Fig. 4
Download original image
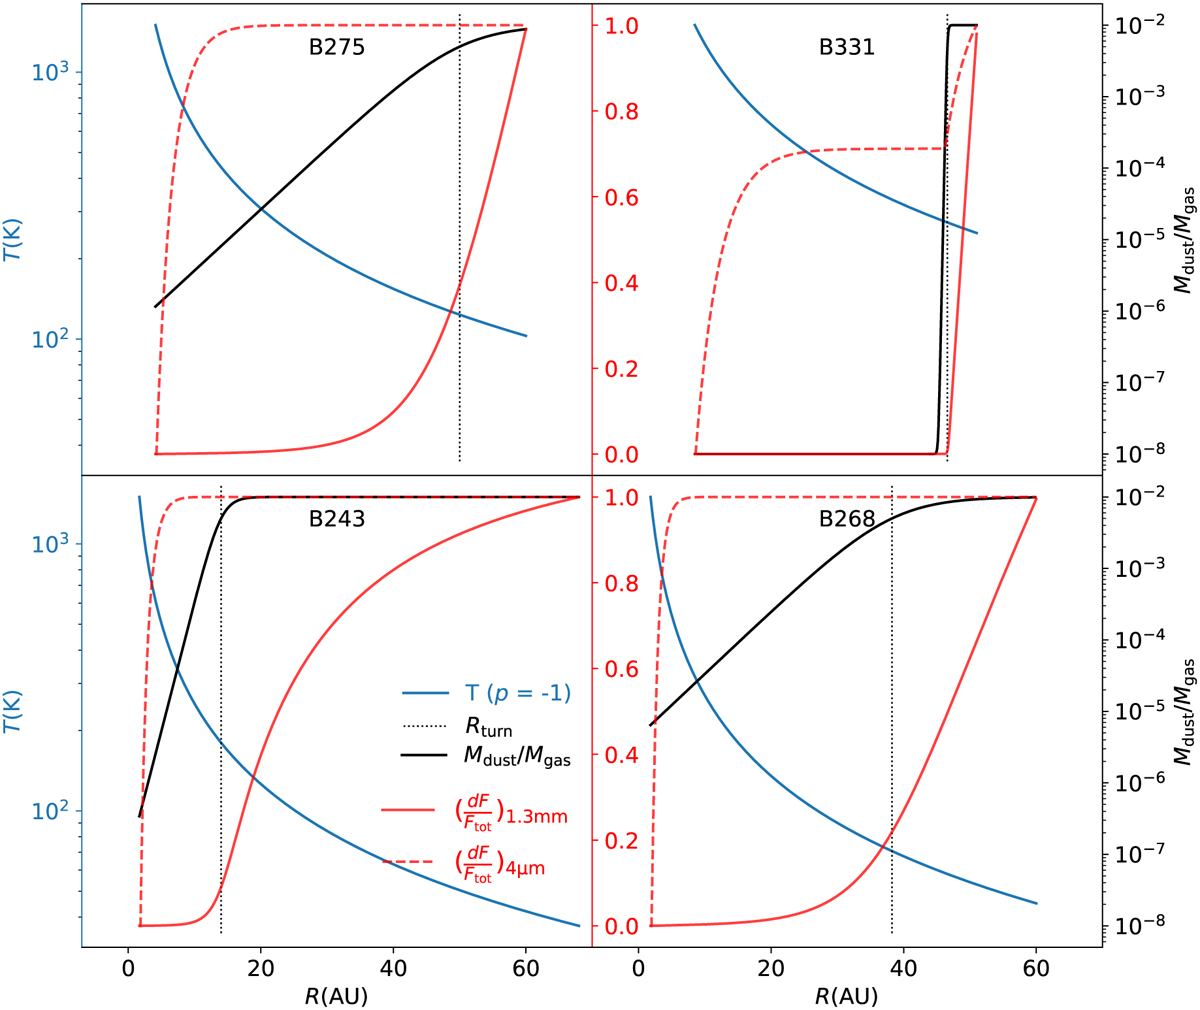
Dust temperature (blue) and dust-to-gas mass ratio (black) as a function of disk radius resulting from the thin disk model fit (described in Sect. 3.5) for each object. The dotted black vertical line indicates the fitted inflection point Rturn of the logistic function of the dust-to-gas mass ratio. In red is the normalized cumulative flux distribution to illustrate where in the disk the majority of the thermal dust emission originates for different wavelengths and how this relates to the local dust abundance and temperature. The red dashed line is for the flux at ∼4 µm, the red solid line for the flux at ∼1.3 mm (ALMA Band 6).
Current usage metrics show cumulative count of Article Views (full-text article views including HTML views, PDF and ePub downloads, according to the available data) and Abstracts Views on Vision4Press platform.
Data correspond to usage on the plateform after 2015. The current usage metrics is available 48-96 hours after online publication and is updated daily on week days.
Initial download of the metrics may take a while.