Fig. 3
Download original image
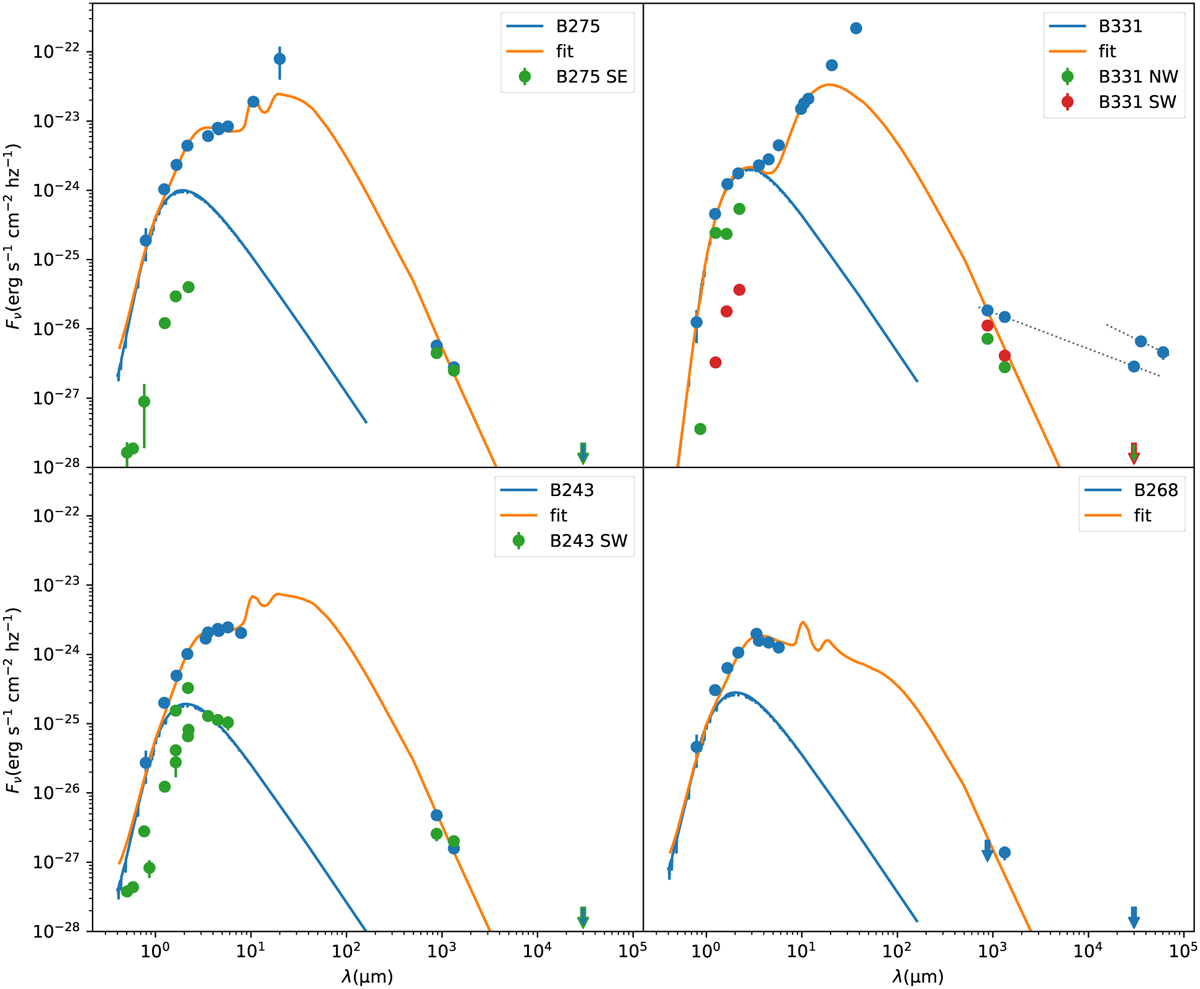
Best fit SEDs, NIR and MIR photometry points, and ALMA and VLA flux points for our four original targets and four sources serendipitously detected in the covered fields. Each panel shows the flux data for the original target and the Kurucz model for its stellar continuum in blue. The best fit model SED from the thin disk modeling (described in Sect. 3.5) is plotted in orange. Each panel also shows the flux data for the serendipitous detection(s) made in the field of the respective original target (in green and red); these data are not fitted. The downward arrows indicate the upper limit derived for nondetections (mostly VLA 10 GHz). Only B331 (upper right panel) is detected at VLA wavelengths. The dotted lines indicate the slopes between the radio flux points for this object, with a spectral index ∼0.67 for the VLA points at 4.96 GHz and 8.46 GHz (Rodríguez et al. 2012), and ∼0.52 between the ALMA and VLA 10 GHz flux points (Yanza et al. 2022). There is an offset between the data from Rodríguez et al. (2012) and (Yanza et al. 2022).
Current usage metrics show cumulative count of Article Views (full-text article views including HTML views, PDF and ePub downloads, according to the available data) and Abstracts Views on Vision4Press platform.
Data correspond to usage on the plateform after 2015. The current usage metrics is available 48-96 hours after online publication and is updated daily on week days.
Initial download of the metrics may take a while.