Fig. 1
Download original image
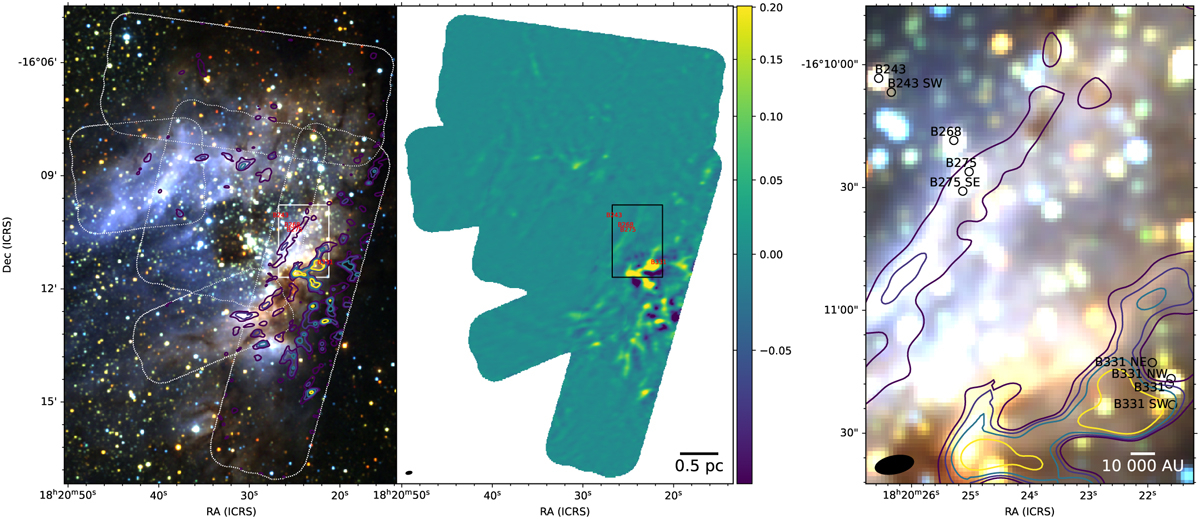
Overview of the M17 region in different wavelengths. The left panel shows a NIR color composite image of M17 based on 2MASS data: J (blue), H (green), and K (red), with large-scale 1.3 mm continuum emission contours (archival ALMA Band 6 data, project code 2018.1.01091.S). Contour levels: 5, 15, 30, and 70 × noise rms (respectively 0.018, 0.053, 0.11, and 0.25 Jy). The middle panel shows only the ALMA mosaic, with the beam size in the bottom left corner. In both panels the rectangular region indicates the field in which all four targets in this study (indicated in red) are found. The rightmost panel is a zoomed-in image of this region with all targets and serendipitous discoveries marked in black. To give an impression of the scales, the radius of each object dot is 1″, which corresponds to five times the image size of each panel in Fig. D.1.
Current usage metrics show cumulative count of Article Views (full-text article views including HTML views, PDF and ePub downloads, according to the available data) and Abstracts Views on Vision4Press platform.
Data correspond to usage on the plateform after 2015. The current usage metrics is available 48-96 hours after online publication and is updated daily on week days.
Initial download of the metrics may take a while.