Open Access
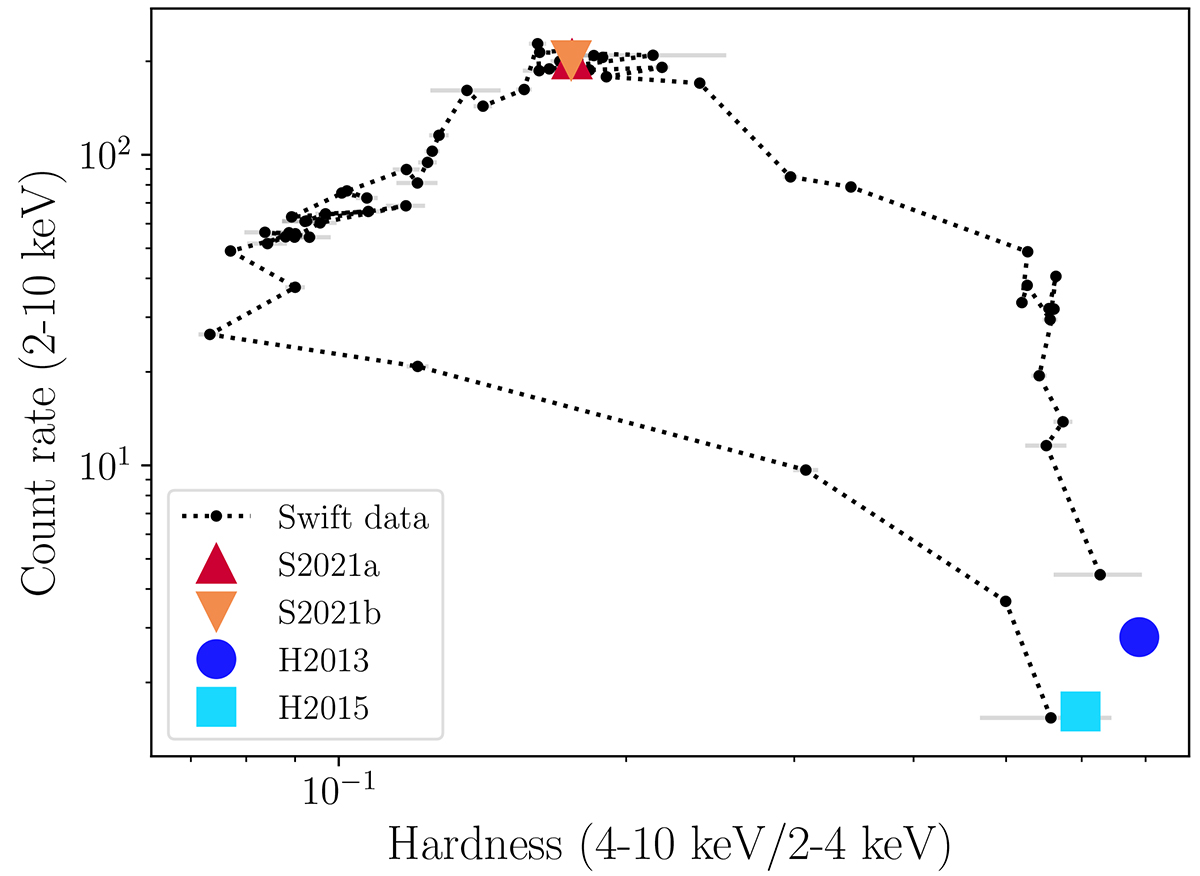
Fig. 1.
Download original image
Swift-XRT HID during the 2021 outburst of GX 339–4. The epochs S2021a and S2021b are marked with up- and down-pointing triangles (overlapping in the figure), correspondingly. The hard state epochs, H2013 and H2015, are marked with a circle and a square, respectively.
Current usage metrics show cumulative count of Article Views (full-text article views including HTML views, PDF and ePub downloads, according to the available data) and Abstracts Views on Vision4Press platform.
Data correspond to usage on the plateform after 2015. The current usage metrics is available 48-96 hours after online publication and is updated daily on week days.
Initial download of the metrics may take a while.