Fig. 9.
Download original image
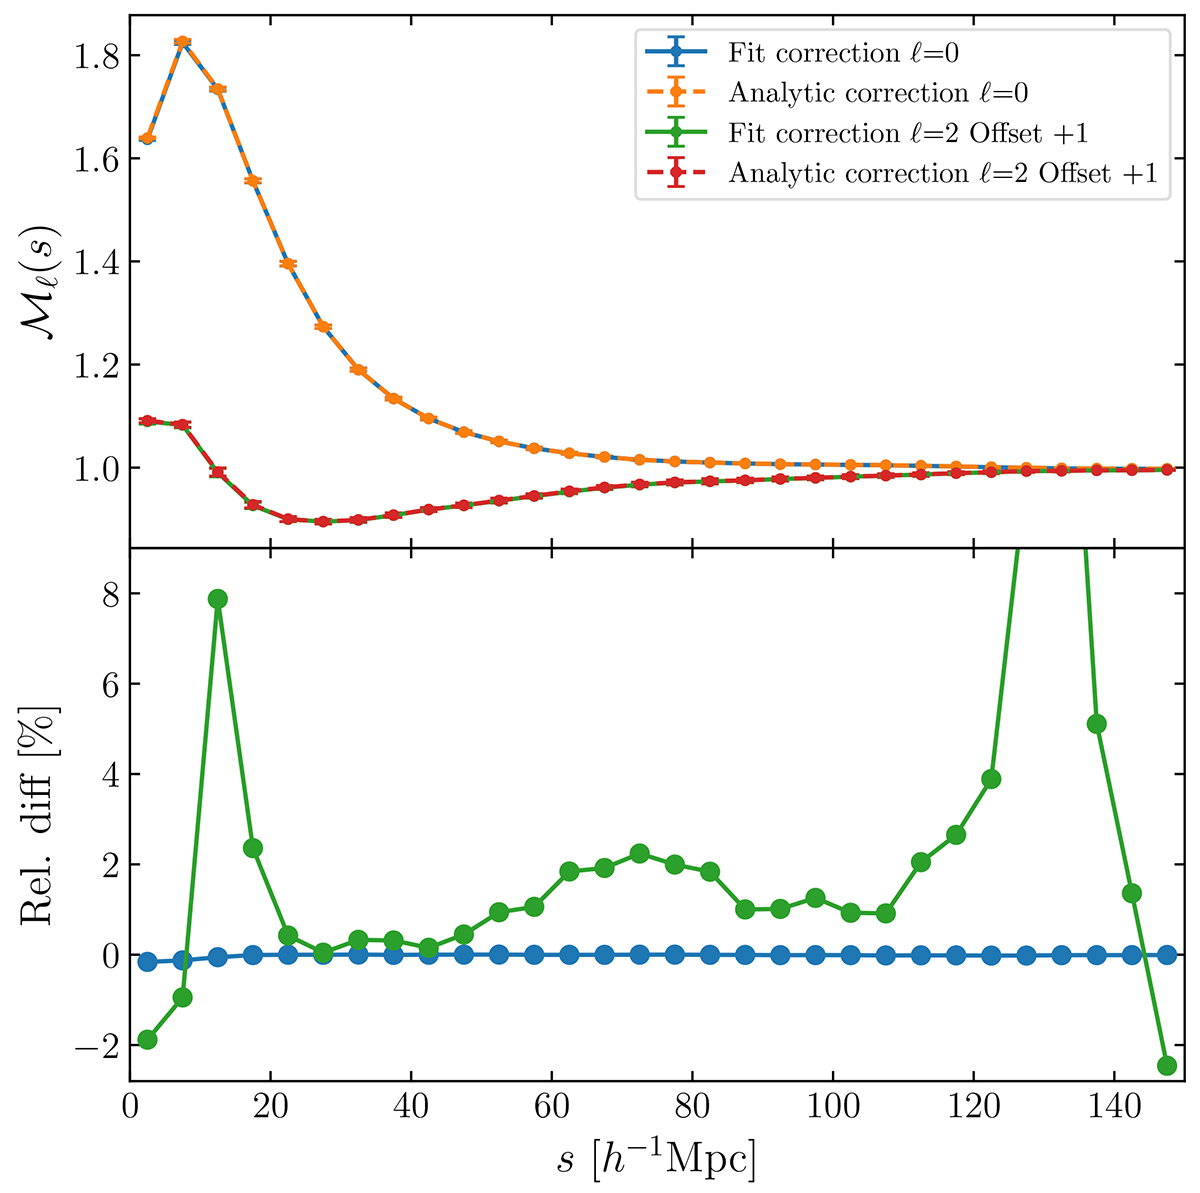
Redshift-space multipoles of the toy model, measured in the GR simulations of ELEPHANT, corrected for shot noise. The upper panel shows both the monopole and quadrupole in different colours corrected via the polynomial fit as solid lines and analytically corrected in dashed lines. In order for better visualisation we offset the quadrupole by +1. Errorbars refer to the mean standard deviation over five realisations. The lower panel shows the relative difference between the analytic and polynomial correction in percent.
Current usage metrics show cumulative count of Article Views (full-text article views including HTML views, PDF and ePub downloads, according to the available data) and Abstracts Views on Vision4Press platform.
Data correspond to usage on the plateform after 2015. The current usage metrics is available 48-96 hours after online publication and is updated daily on week days.
Initial download of the metrics may take a while.