Fig. 7.
Download original image
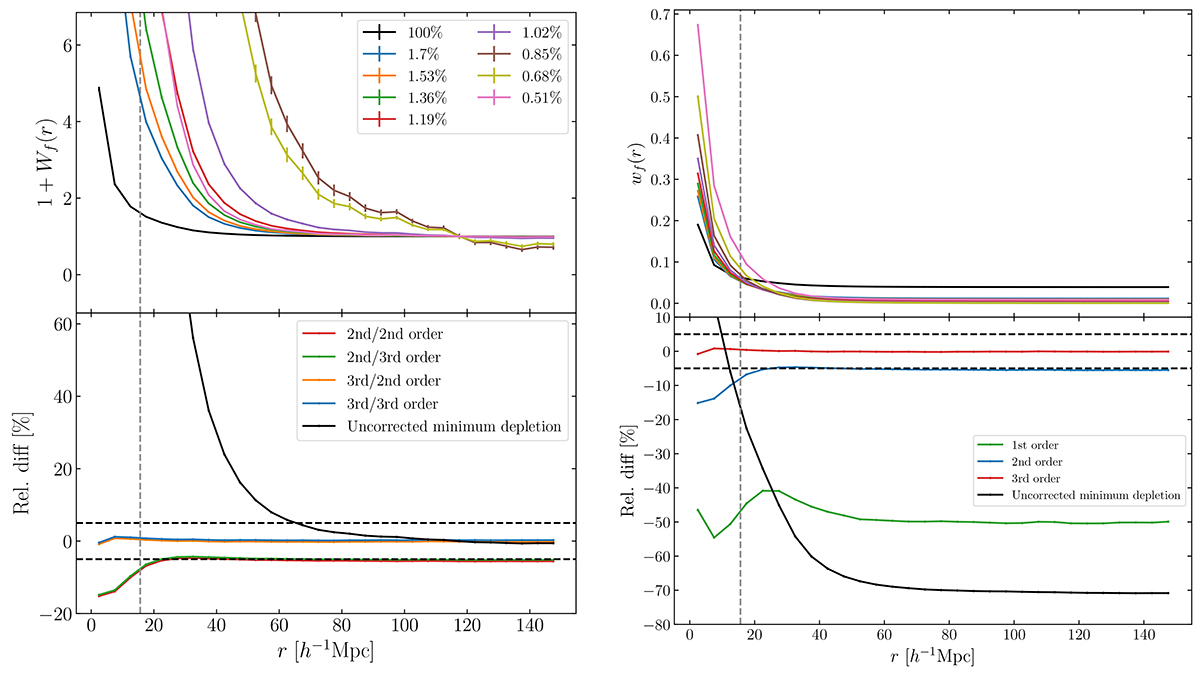
Results of the fitted shot-noise correction for the tanh-mark with (a, b) = (0.6, −0.5). The left panels present 1 + Wf while the right panel shows ![]() . Different colours in the upper panel refer to the mean over five Covmos realisations and errorbars correspond to the mean standard deviation over those five realisations. Depleted measurements were obtained by taking the mean over 100 realisations of depletions. The bottom panels show the relative differences of the corrected signal from the fit to the undepleted reference case. Different colours in the lower panels refer to different orders used in the polynomial fit and e.g. ‘3rd/2nd’ indicates that a third- and second-order polynomial fit was used for wf and
. Different colours in the upper panel refer to the mean over five Covmos realisations and errorbars correspond to the mean standard deviation over those five realisations. Depleted measurements were obtained by taking the mean over 100 realisations of depletions. The bottom panels show the relative differences of the corrected signal from the fit to the undepleted reference case. Different colours in the lower panels refer to different orders used in the polynomial fit and e.g. ‘3rd/2nd’ indicates that a third- and second-order polynomial fit was used for wf and ![]() , respectively. The horizontal dashed lines in black corresponds to a relative difference of ±5% and the vertical dashed line in grey refers to the side length of one grid cell.
, respectively. The horizontal dashed lines in black corresponds to a relative difference of ±5% and the vertical dashed line in grey refers to the side length of one grid cell.
Current usage metrics show cumulative count of Article Views (full-text article views including HTML views, PDF and ePub downloads, according to the available data) and Abstracts Views on Vision4Press platform.
Data correspond to usage on the plateform after 2015. The current usage metrics is available 48-96 hours after online publication and is updated daily on week days.
Initial download of the metrics may take a while.