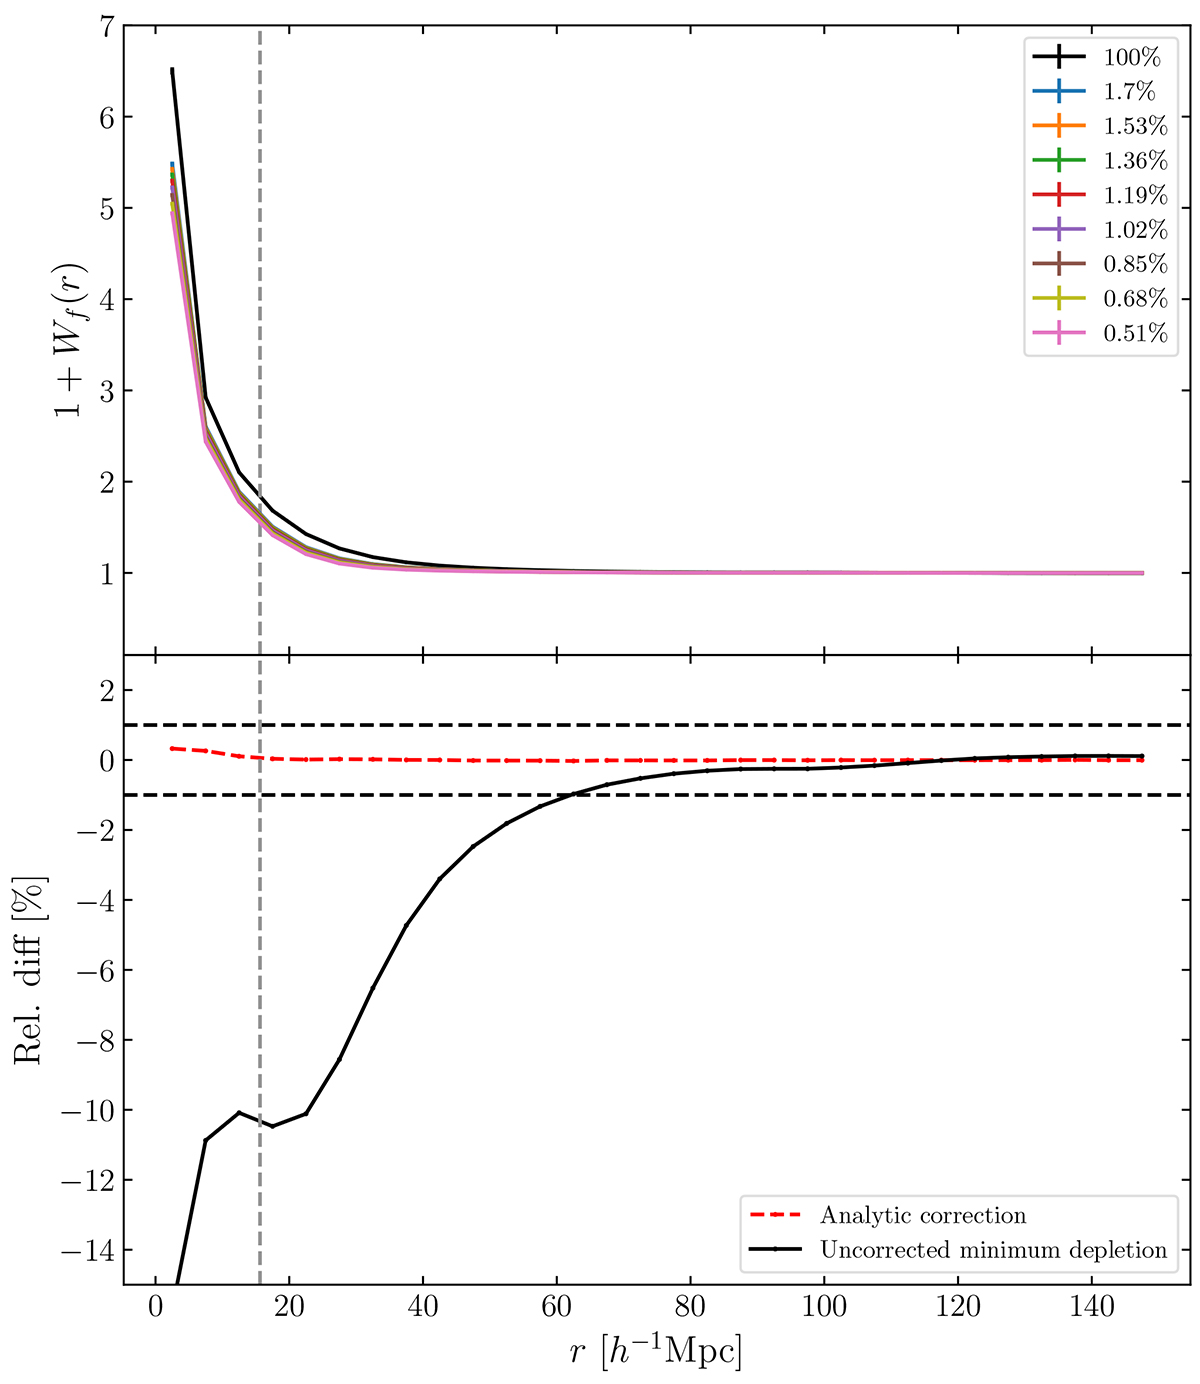
Fig. 5.
Download original image
Results of the analytic shot-noise correction applied to the toy model for which only one point in a pair is weighted by the density contrast δRf. The upper panel shows the full weighted correlation function 1 + Wf as a mean over the five Covmos realisations, where different colours denote different levels of depletion. Errorbars are computed by taking the mean standard deviation over five realisations. To obtain the depleted catalogues we took the mean over 100 depletions. The lower panel shows the relative difference of the analytically corrected result to the undepleted case as a red dashed line. The solid black line refers to the relative difference of the depletion level 1.7% to the undepleted case, which illustrates the effect of no correction. Horizontal dashed lines in black indicate levels of relative differences of ±1% and the vertical dashed line in grey refers to side length of one grid cell. We used 64 grid cells per dimension and a PCS MAS to obtain the density field on the grid.
Current usage metrics show cumulative count of Article Views (full-text article views including HTML views, PDF and ePub downloads, according to the available data) and Abstracts Views on Vision4Press platform.
Data correspond to usage on the plateform after 2015. The current usage metrics is available 48-96 hours after online publication and is updated daily on week days.
Initial download of the metrics may take a while.