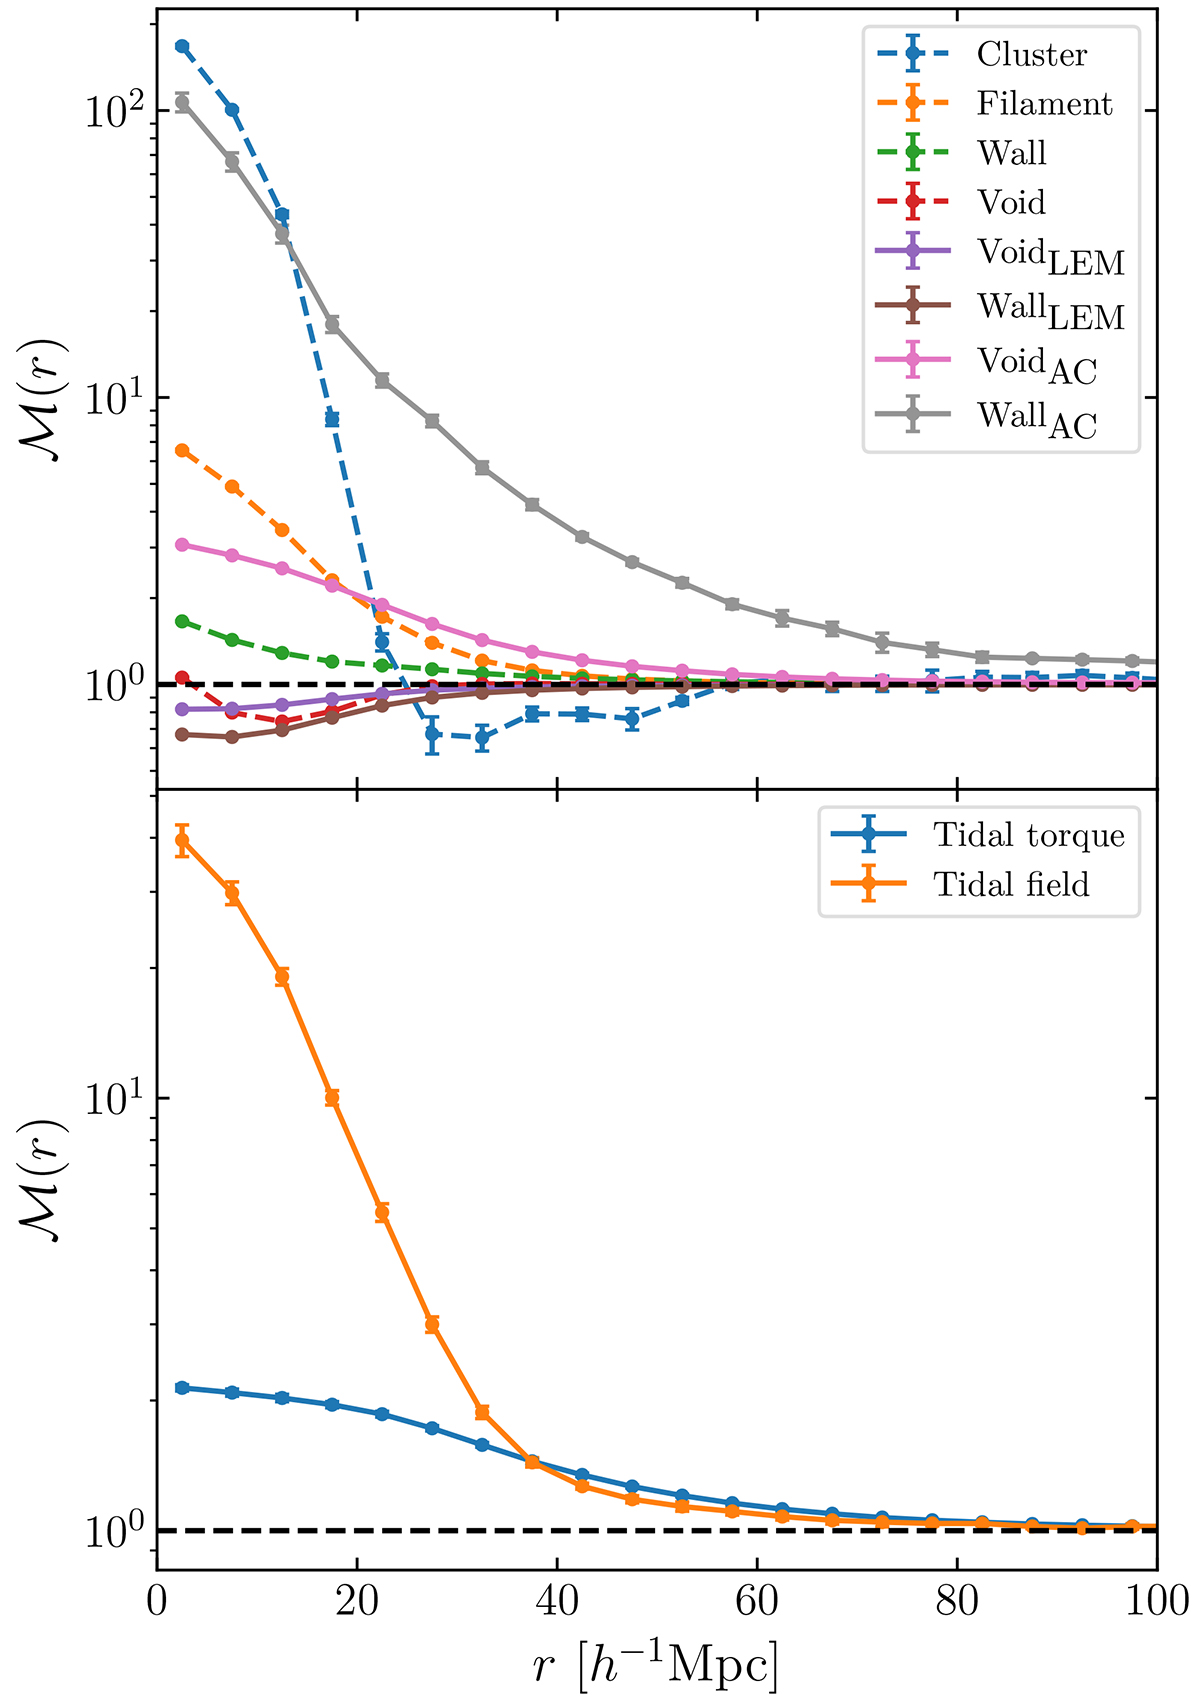
Fig. 3.
Download original image
Summary of the different marked correlation functions using marks based on the tidal field, tidal torque (both in the lower panel) or large-scale environment (upper panel). The two panels show measurements made using the ELEPHANT simulations of GR. The black dashed line indicates an amplitude of 1. Curves represent the mean taken over five realisations and the error corresponds to the mean standard deviation over five realisations. The measurements have not been corrected for any form of bias due to shot-noise effects.
Current usage metrics show cumulative count of Article Views (full-text article views including HTML views, PDF and ePub downloads, according to the available data) and Abstracts Views on Vision4Press platform.
Data correspond to usage on the plateform after 2015. The current usage metrics is available 48-96 hours after online publication and is updated daily on week days.
Initial download of the metrics may take a while.