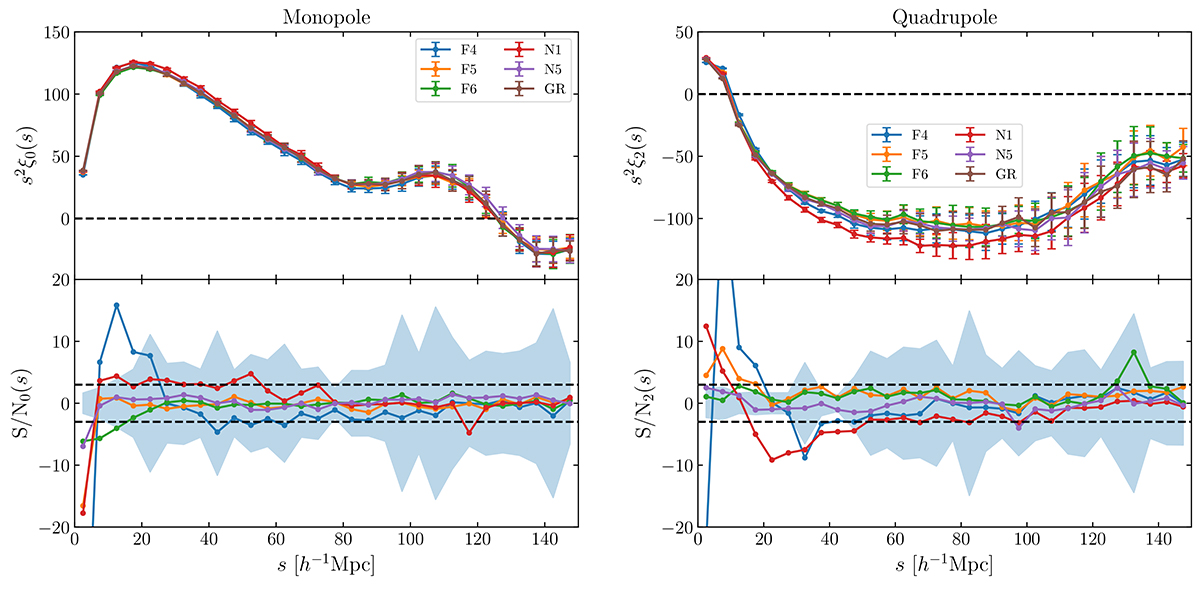
Fig. 2.
Download original image
Differences in the standard measured correlation function multipoles in redshift space between GR and MG. The upper panels present the mean correlation function multipoles taken over five realisations with the monopole on the left side and the quadrupole on the right side. The errorbars correspond to the mean standard deviation over five realisations. The lower panels show the respective S/N with 3σ indicated by the black dashed lines. The colour coding refers to different gravity simulations and the corresponding shaded regions refer to the error of a single measurement divided by the mean error of the difference (see Eq. (38)).
Current usage metrics show cumulative count of Article Views (full-text article views including HTML views, PDF and ePub downloads, according to the available data) and Abstracts Views on Vision4Press platform.
Data correspond to usage on the plateform after 2015. The current usage metrics is available 48-96 hours after online publication and is updated daily on week days.
Initial download of the metrics may take a while.