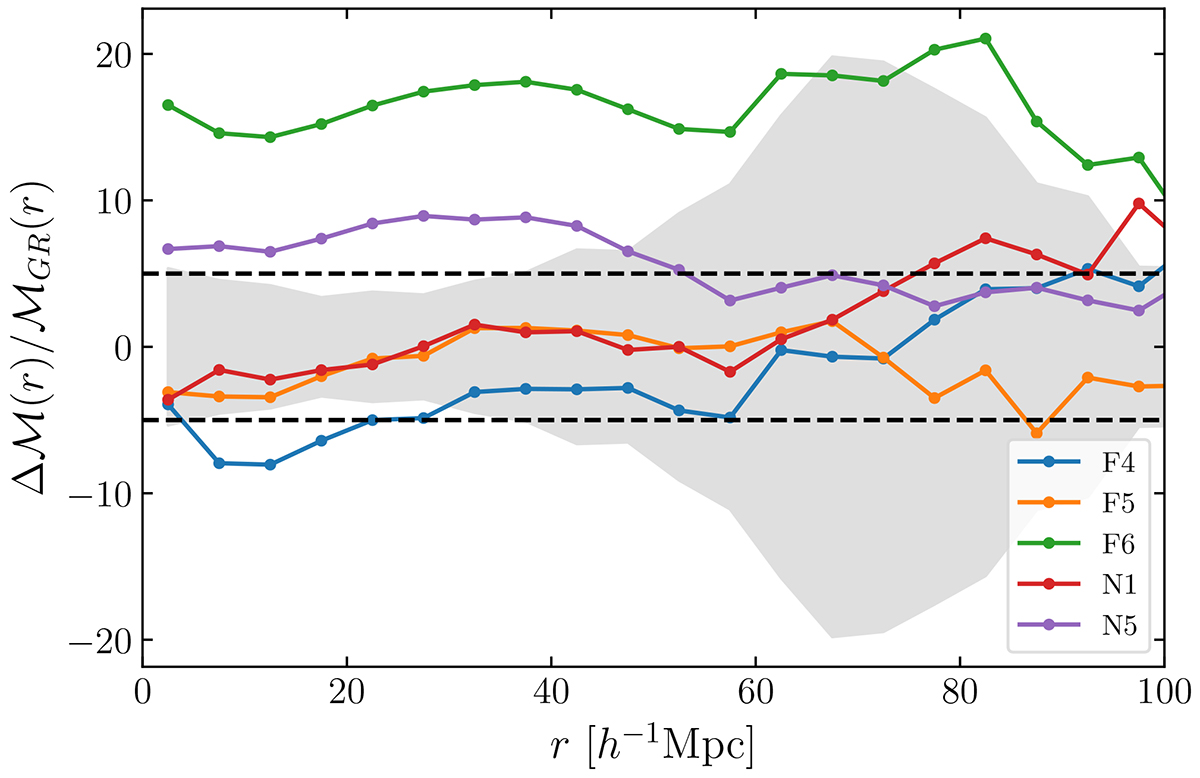
Fig. 18.
Download original image
Relative differences between GR and MG for the tanh-mark with parameters fixed to (a, b) = (0.6, −0.5). We show the mean relative difference over five realisations and the shaded area corresponds to the relative standard deviation (relative error of single measurement) for the GR realisations. Grey dashed lines indicate relative differences of ±5%.
Current usage metrics show cumulative count of Article Views (full-text article views including HTML views, PDF and ePub downloads, according to the available data) and Abstracts Views on Vision4Press platform.
Data correspond to usage on the plateform after 2015. The current usage metrics is available 48-96 hours after online publication and is updated daily on week days.
Initial download of the metrics may take a while.