Fig. 17.
Download original image
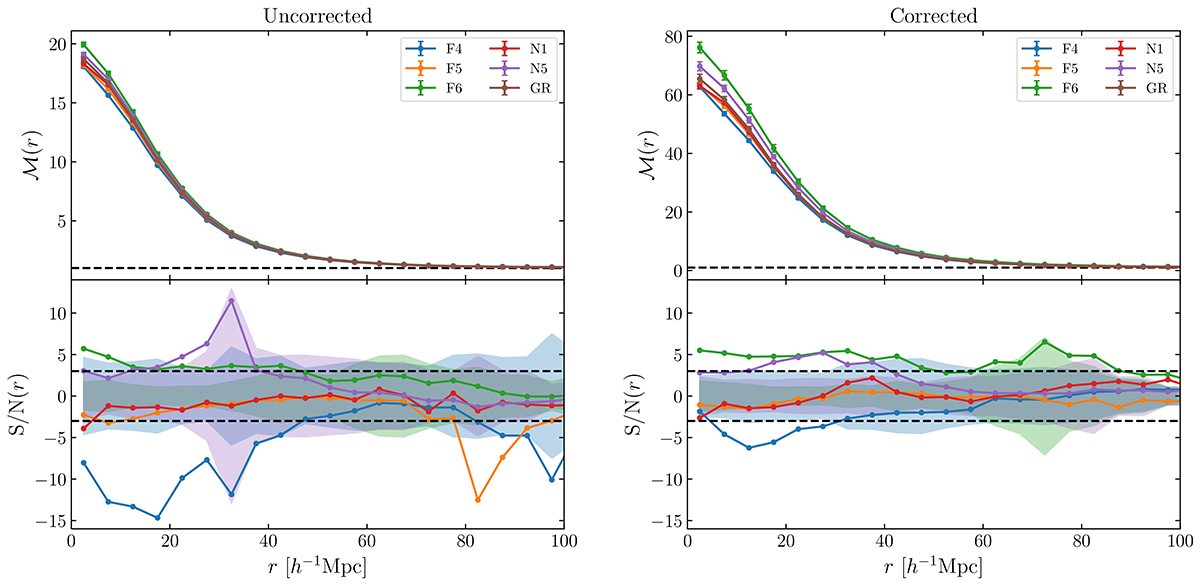
Marked correlation function for the tanh-mark with (a, b) = (0.6, −0.5). The left panels depict the case where we do not apply any correction for shot noise while in the right panels we do apply our shot-noise correction methodology as described in Sect. 6. Upper panels show the marked correlation functions with colours encoding the different MG models. Displayed is the mean over five realisations and errorbars are obtained by taking the mean standard deviation. The lower panel displays the S/N where the black-dashed line indicates a difference of ±3. Shaded areas mark the error of a single measurement divided by the mean error of the difference. The black dashed line in the upper panels indicates an amplitude of 1.
Current usage metrics show cumulative count of Article Views (full-text article views including HTML views, PDF and ePub downloads, according to the available data) and Abstracts Views on Vision4Press platform.
Data correspond to usage on the plateform after 2015. The current usage metrics is available 48-96 hours after online publication and is updated daily on week days.
Initial download of the metrics may take a while.