Fig. 16.
Download original image
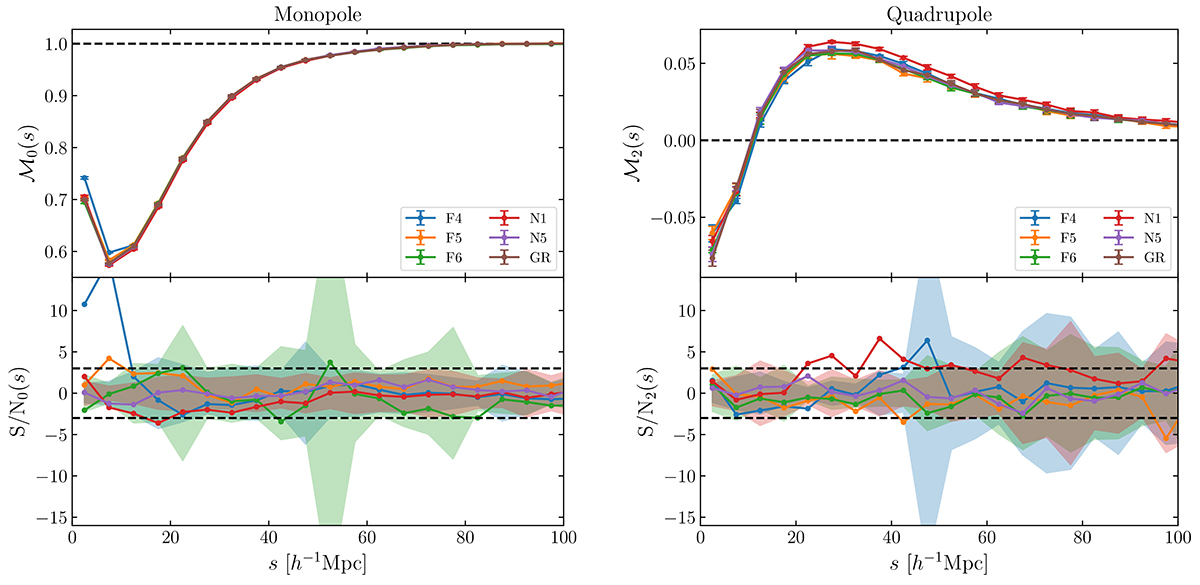
Redshift-space monopole (left side) and quadrupole (right side) of the marked correlation function for the White mark with parameters fixed to (ρ*, p) = (10−6, 1.0) and corrected for shot noise. Upper panels show the multipoles themselves with colours referring to different gravity simulations. Displayed is the mean over five realisations with respective mean standard deviations as the error bars. For the monopole the horizontal dashed line in black marks an amplitude of 1 while for the quadrupole it marks an amplitude of 0. Lower panels show the signal to noise ratio, as in Eq. (37), with according colour for the different MG models. Shaded regions refer to the error of a single measurement divided by the mean error of the difference as introduced in Eq. (38). Dashed black lines in the lower panels indicate a S/N of ±3.
Current usage metrics show cumulative count of Article Views (full-text article views including HTML views, PDF and ePub downloads, according to the available data) and Abstracts Views on Vision4Press platform.
Data correspond to usage on the plateform after 2015. The current usage metrics is available 48-96 hours after online publication and is updated daily on week days.
Initial download of the metrics may take a while.