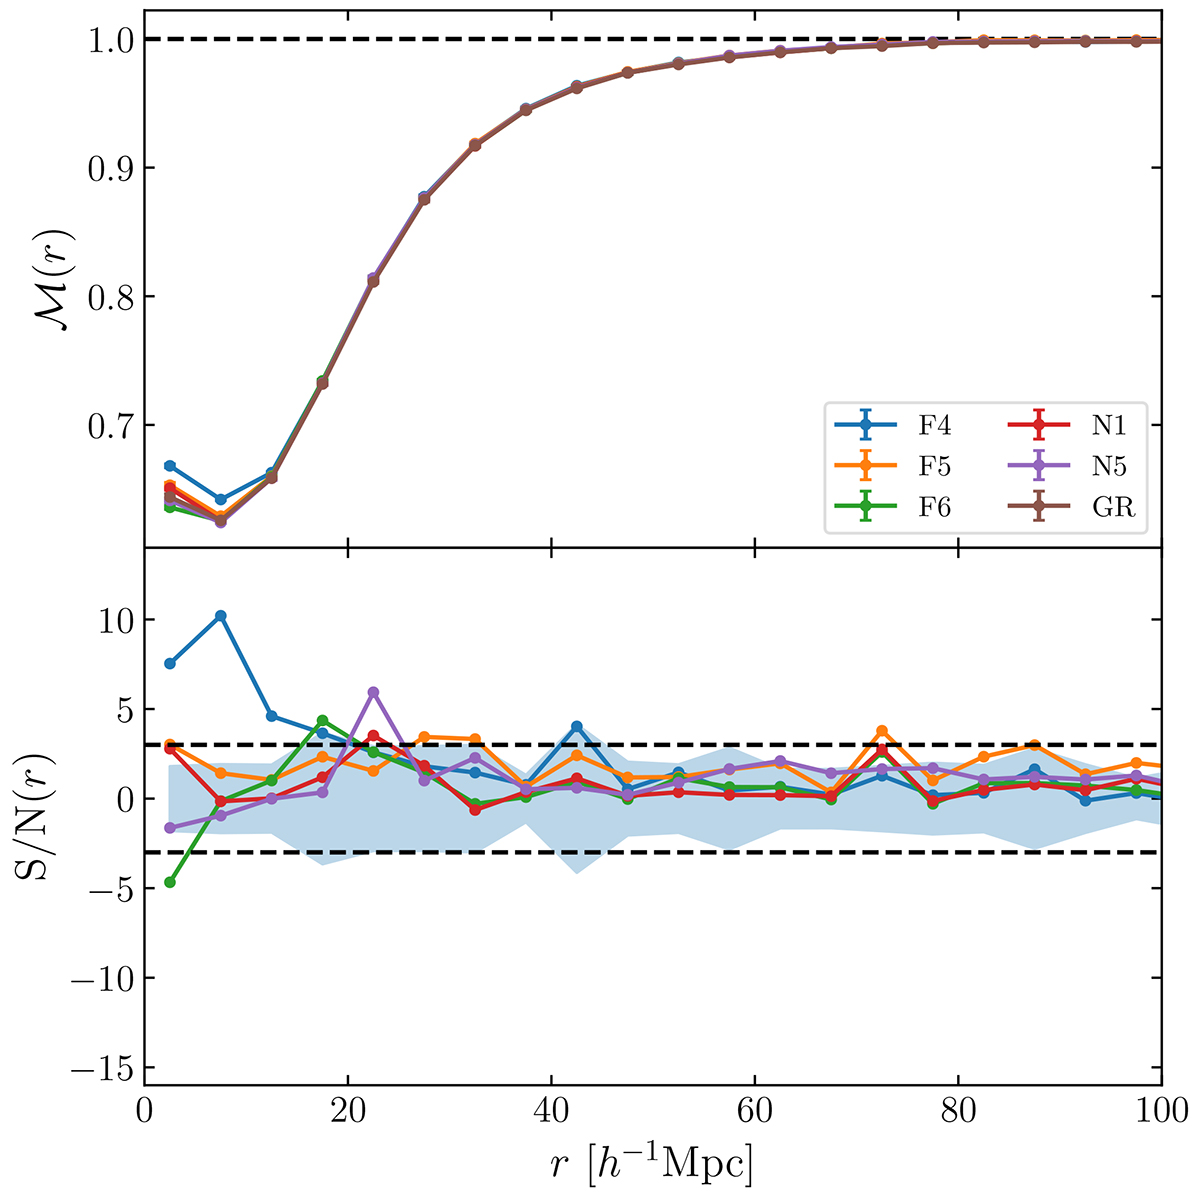
Fig. 15.
Download original image
Performance of the White mark for fixed parameters (ρ*, p) = (10−6, 1.0). The upper panel displays the mean marked correlation function taken over five realisations together with errorbars estimated as the mean standard deviation. Colours refer to the different gravity simulations. The lower panel shows the S/N, as introduced in Eq. (37) and the blue shaded region refers to the error of a single measurements divided by the error of the mean difference (see Eq. (38)) for F4.
Current usage metrics show cumulative count of Article Views (full-text article views including HTML views, PDF and ePub downloads, according to the available data) and Abstracts Views on Vision4Press platform.
Data correspond to usage on the plateform after 2015. The current usage metrics is available 48-96 hours after online publication and is updated daily on week days.
Initial download of the metrics may take a while.