Open Access
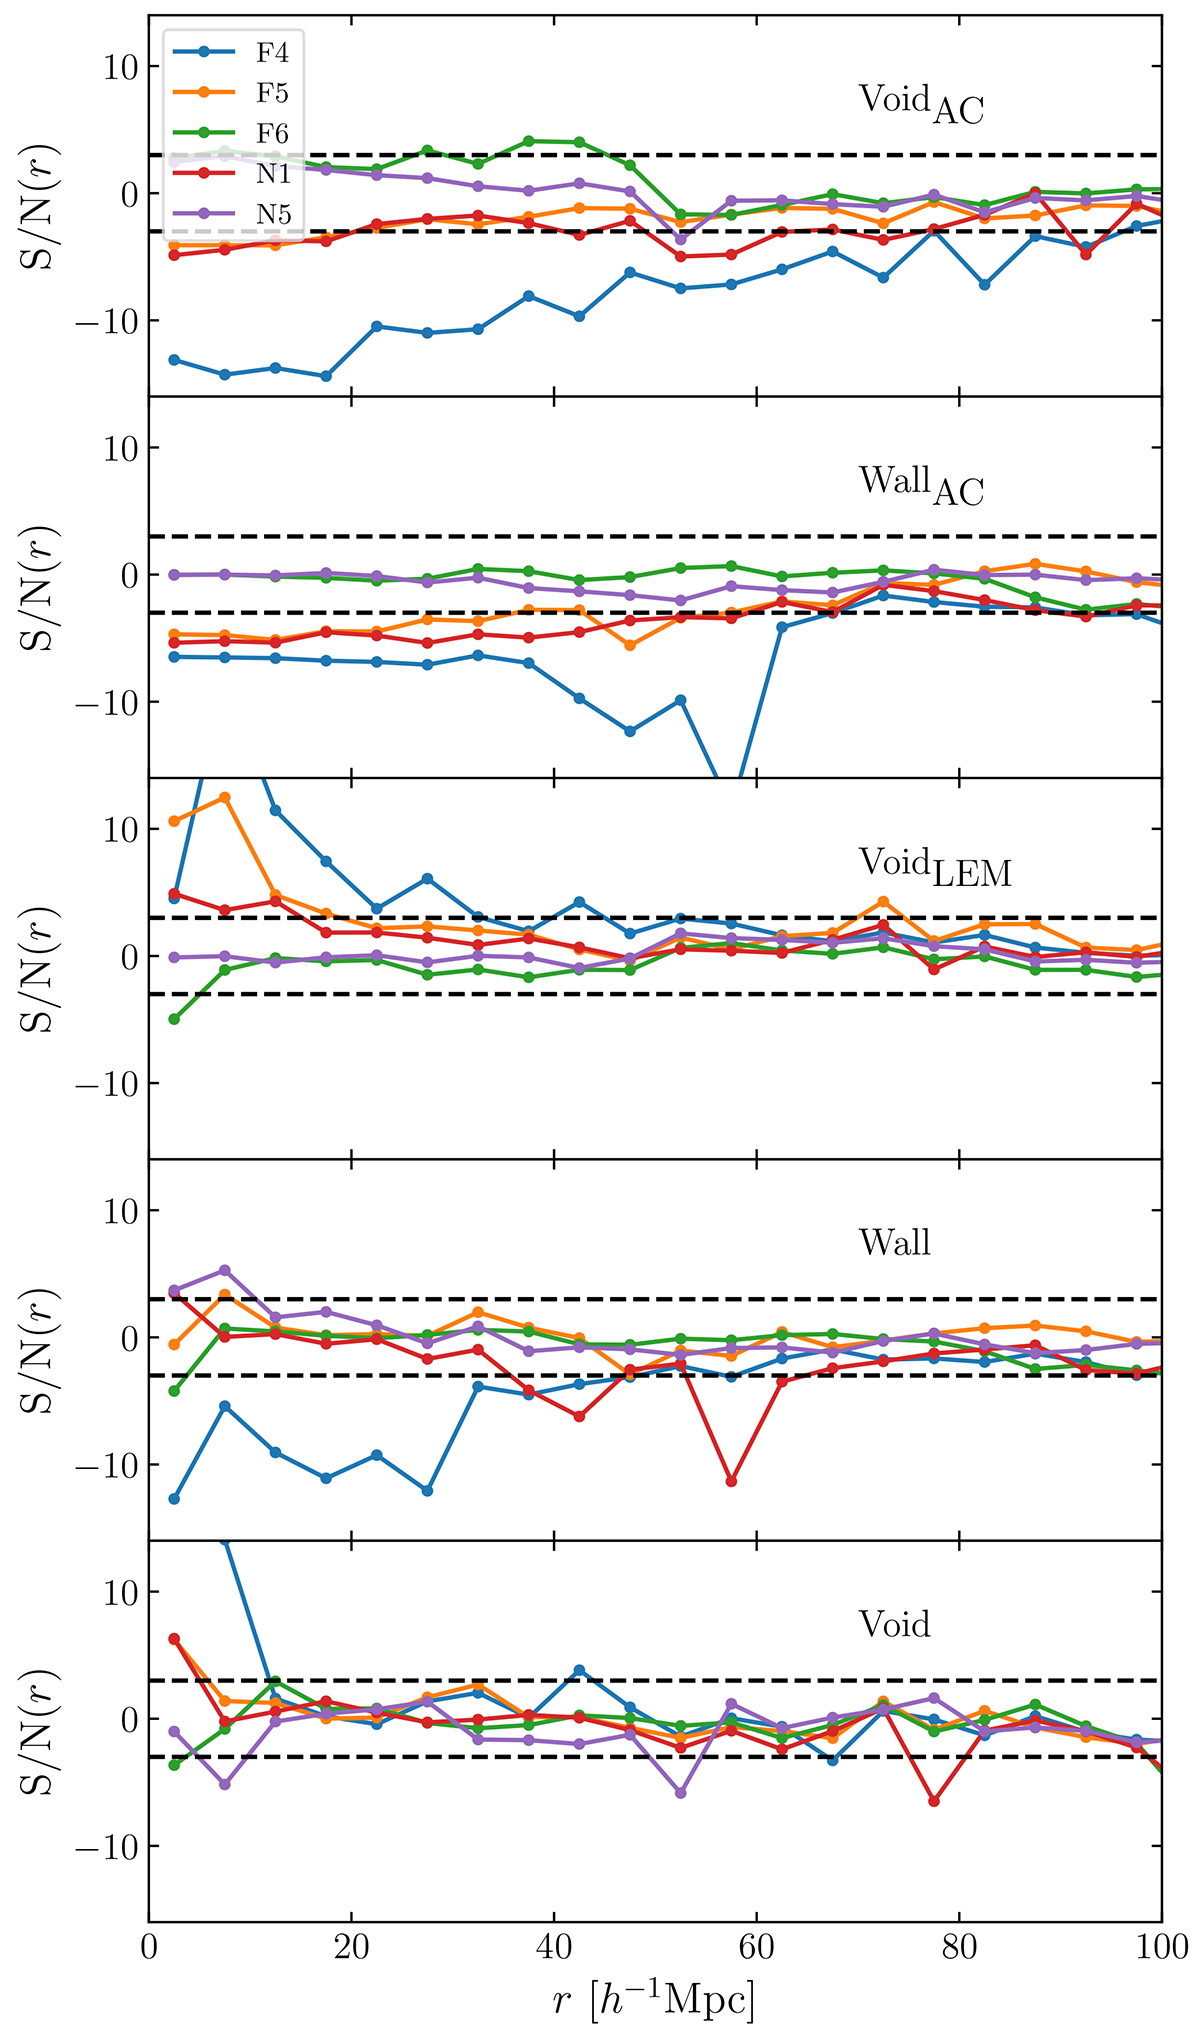
Fig. 13.
Download original image
S/N measured in the ELEPHANT suite for the marked correlation functions using marks based on the large-scale environment as introduced in Sect. 5. Colours refer to MG simulations and the panels show different marks as indicated on the labels. The horizontal dashed lines in black indicate a S/N of ±3.
Current usage metrics show cumulative count of Article Views (full-text article views including HTML views, PDF and ePub downloads, according to the available data) and Abstracts Views on Vision4Press platform.
Data correspond to usage on the plateform after 2015. The current usage metrics is available 48-96 hours after online publication and is updated daily on week days.
Initial download of the metrics may take a while.