Fig. 12.
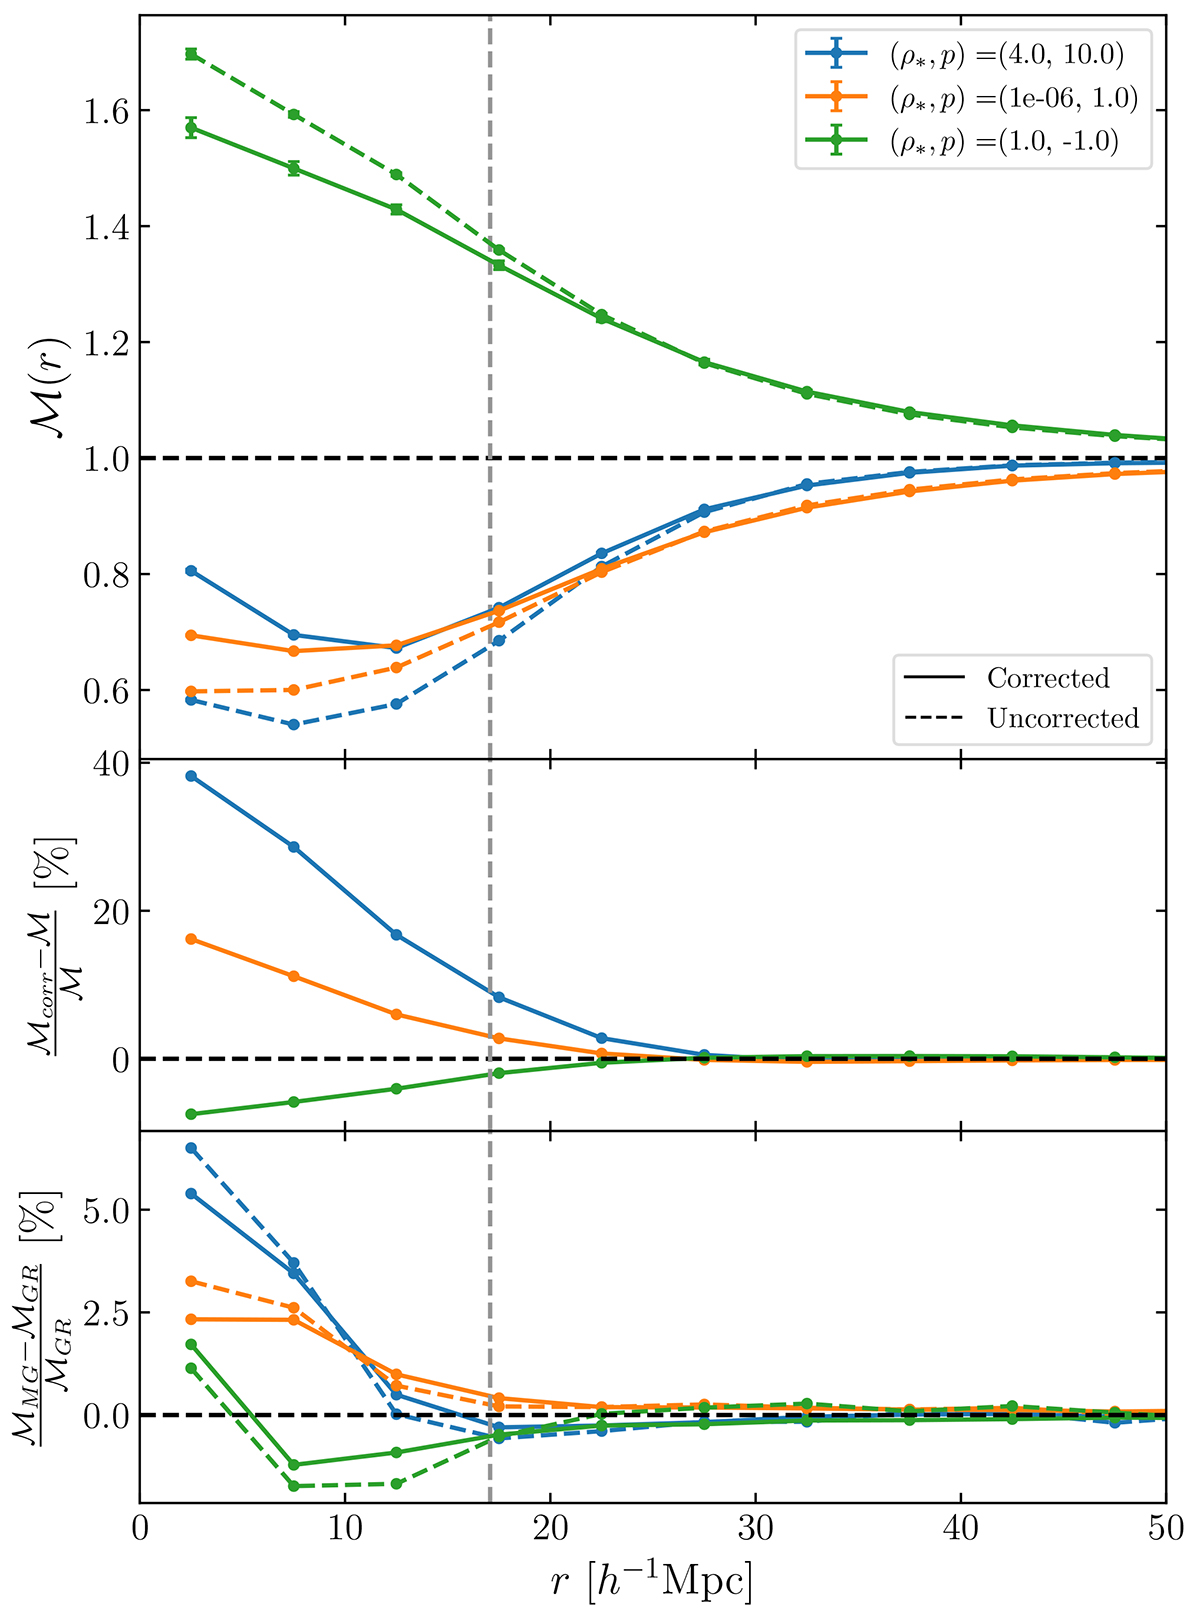
Download original image
Shot noise in the White mark for the ELEPHANT suite. The different configurations of parameters are colour coded and the solid line refers to the corrected case while the dashed line refers to the uncorrected case. The upper panel displays the marked correlation function both corrected and uncorrected. The middle panel shows the relative difference between the corrected and the uncorrected marked correlation function in percent. The MG model is fixed to F4 in the upper and the middle panel. In the lower panel we show the relative differences for the different configurations between the F4 model and GR in percent. We used 60 grid cells per dimension and the vertical dashed line in grey refers to the side length of one grid cell.
Current usage metrics show cumulative count of Article Views (full-text article views including HTML views, PDF and ePub downloads, according to the available data) and Abstracts Views on Vision4Press platform.
Data correspond to usage on the plateform after 2015. The current usage metrics is available 48-96 hours after online publication and is updated daily on week days.
Initial download of the metrics may take a while.