Fig. 11.
Download original image
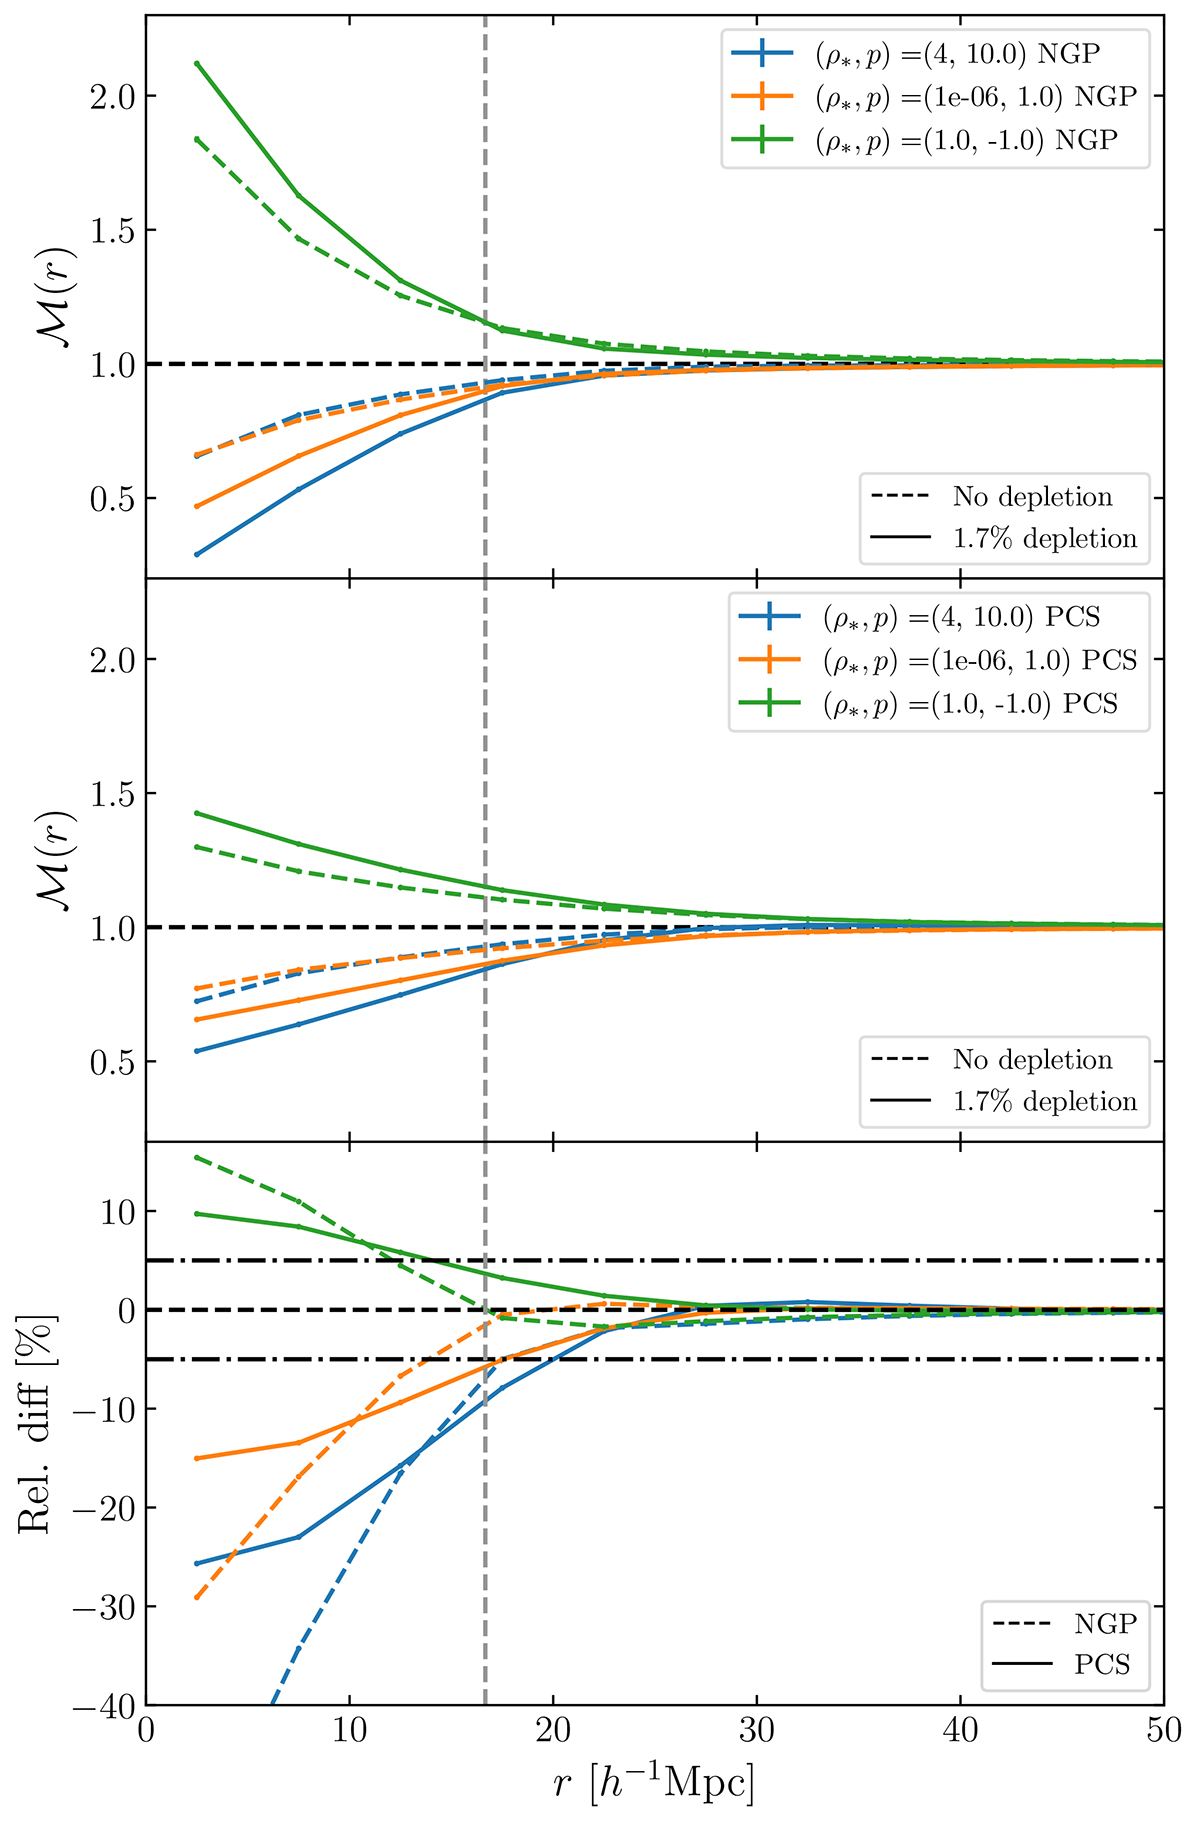
Marked correlation functions for the White mark measured in the Covmos catalogues. The upper and middle panel show the marked correlation functions for different configurations of the parameters (ρ*, p) using NGP and PCS MAS, respectively. The dashed line refers to the undepleted case, whereas the solid line shows the measurement for a depleted catalogue down to 1.7%, which corresponds to the same mean density of points per grid cell as in the undepleted ELEPHANT simulations. The lowest panel displays the relative difference between the marked correlation function as measured in the full data set and the depleted one. We used 60 grid cells per side length for the density field and the vertical dashed line in grey corresponds to the side length of a grid cell.
Current usage metrics show cumulative count of Article Views (full-text article views including HTML views, PDF and ePub downloads, according to the available data) and Abstracts Views on Vision4Press platform.
Data correspond to usage on the plateform after 2015. The current usage metrics is available 48-96 hours after online publication and is updated daily on week days.
Initial download of the metrics may take a while.