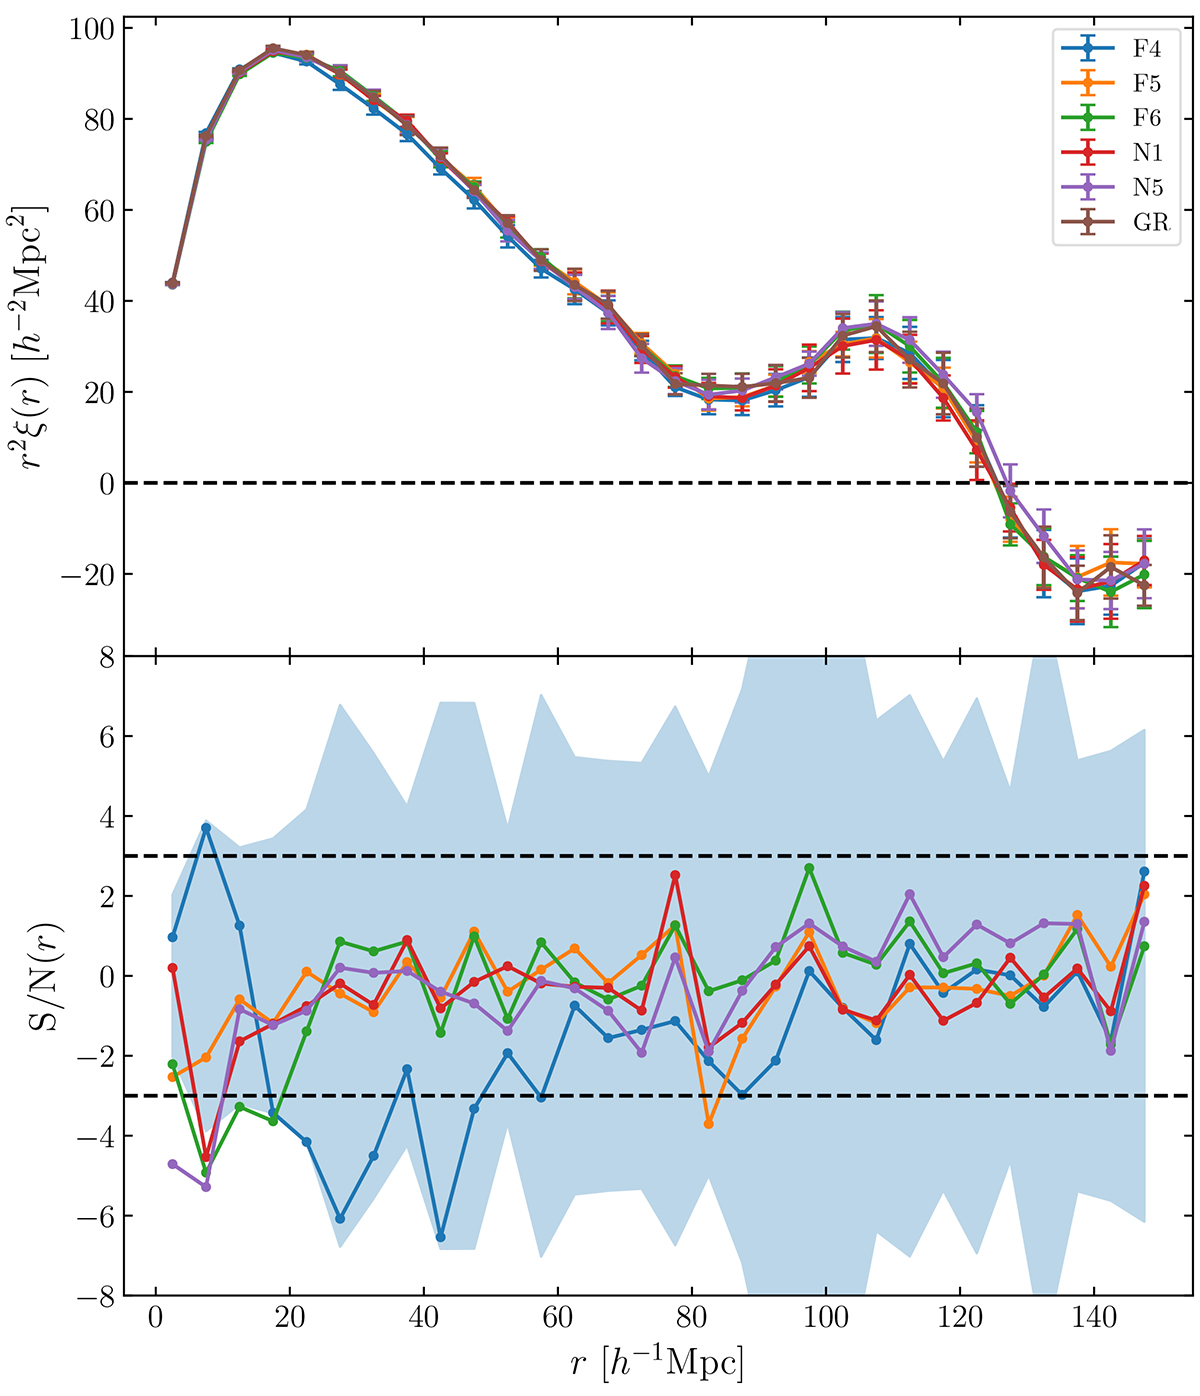
Fig. 1.
Download original image
Difference in the measured standard correlation function ξ(r) between GR and MG in real space. In the upper panel, the correlation functions themselves are plotted where different colours indicate the underlying gravity theory. The curves show the average over five realisations and the errorbars correspond to the mean standard deviation over these realisations. The lower panel quantifies possible differences in terms of the S/N, as introduced in Sect. 4. Black dashed lines indicate a S/N of ±3. The shaded region refers to the error of a single measurement divided by the mean error of the difference as described in Eq. (38).
Current usage metrics show cumulative count of Article Views (full-text article views including HTML views, PDF and ePub downloads, according to the available data) and Abstracts Views on Vision4Press platform.
Data correspond to usage on the plateform after 2015. The current usage metrics is available 48-96 hours after online publication and is updated daily on week days.
Initial download of the metrics may take a while.