Open Access
Fig. 6.
Download original image
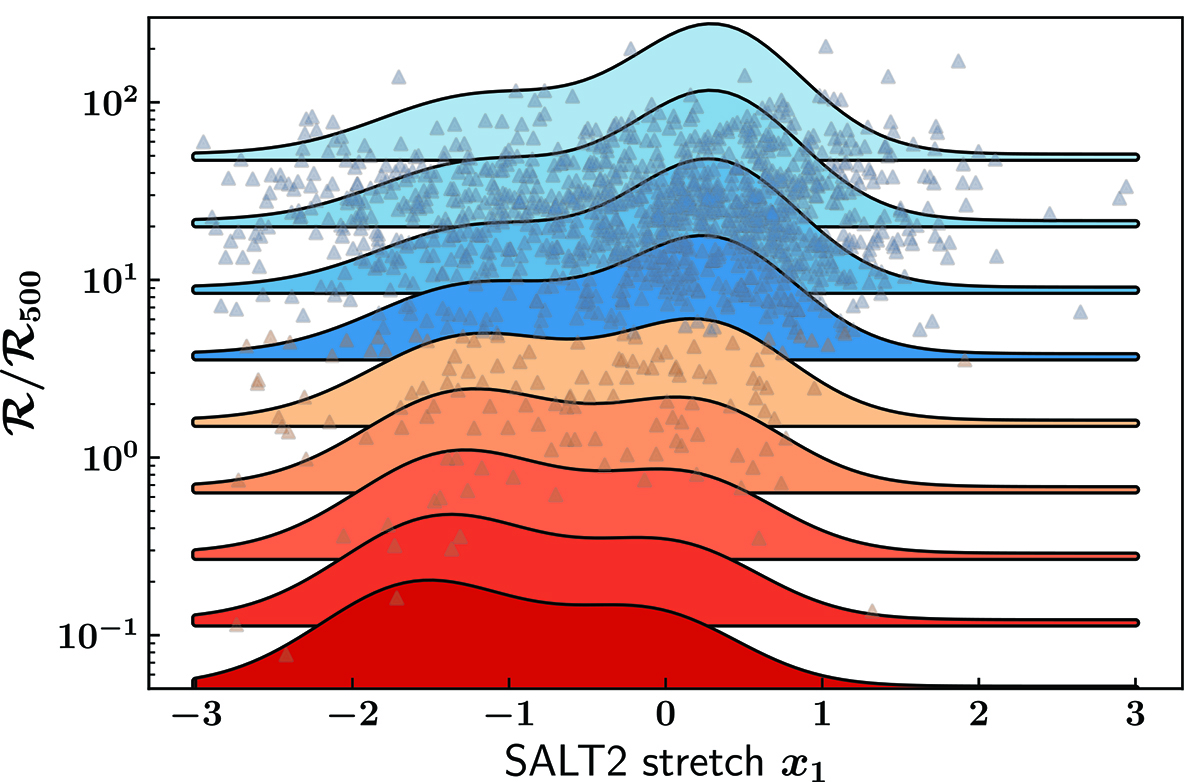
Best-fit conditional distributions of the stretch parameter for different values of ℛ/ℛ500 at the median redshift ![]() . Our data set is shown as orange and blue triangles following the color-code introduced in Fig. 3.
. Our data set is shown as orange and blue triangles following the color-code introduced in Fig. 3.
Current usage metrics show cumulative count of Article Views (full-text article views including HTML views, PDF and ePub downloads, according to the available data) and Abstracts Views on Vision4Press platform.
Data correspond to usage on the plateform after 2015. The current usage metrics is available 48-96 hours after online publication and is updated daily on week days.
Initial download of the metrics may take a while.