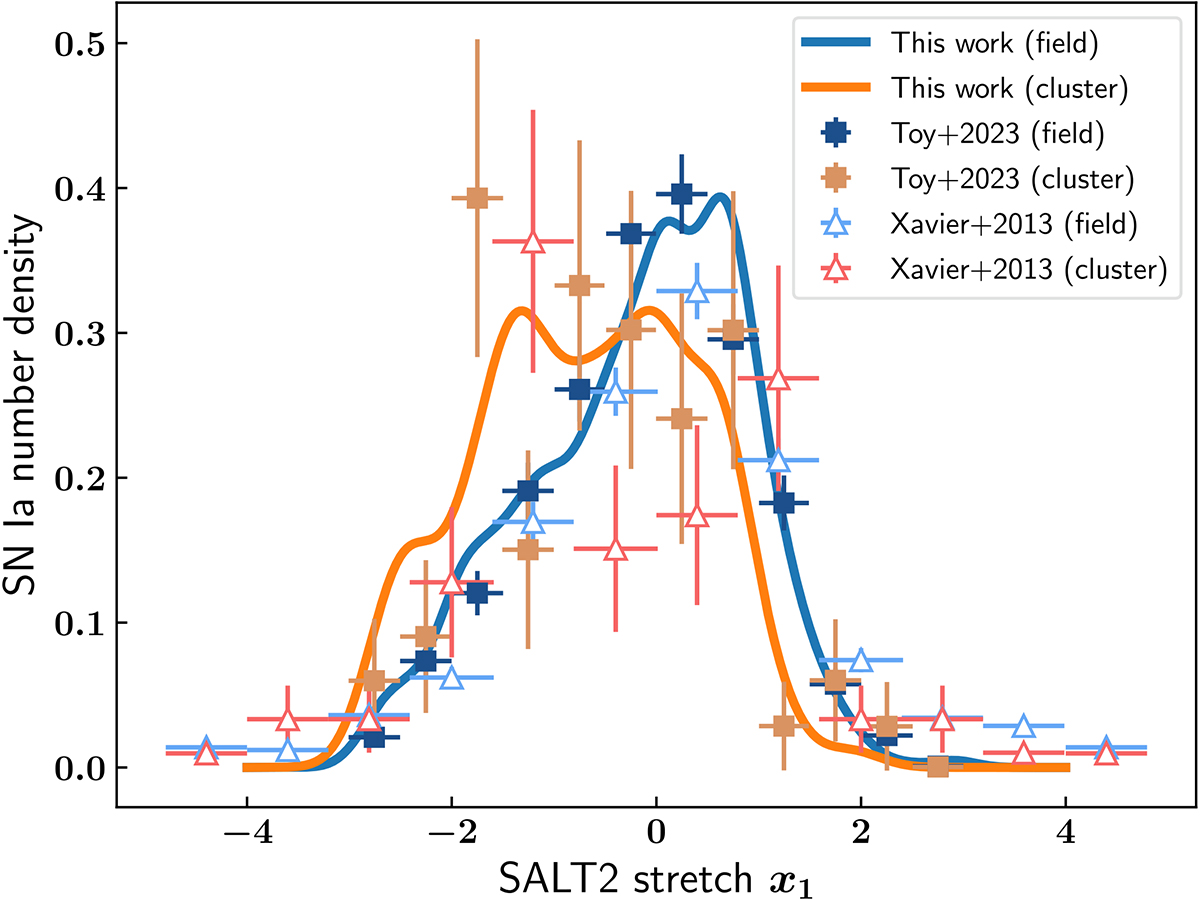
Fig. 4.
Download original image
Comparison between the stretch distributions observed in clusters (ℛ < 5ℛ500, orange line) and in the field (ℛ > 10ℛ500, blue line) with results from previous works. The stretch distributions obtained in clusters (the field) in Xavier et al. (2013) and Toy et al. (2023) are given by the red-orange (blue) triangles and squares, respectively.
Current usage metrics show cumulative count of Article Views (full-text article views including HTML views, PDF and ePub downloads, according to the available data) and Abstracts Views on Vision4Press platform.
Data correspond to usage on the plateform after 2015. The current usage metrics is available 48-96 hours after online publication and is updated daily on week days.
Initial download of the metrics may take a while.