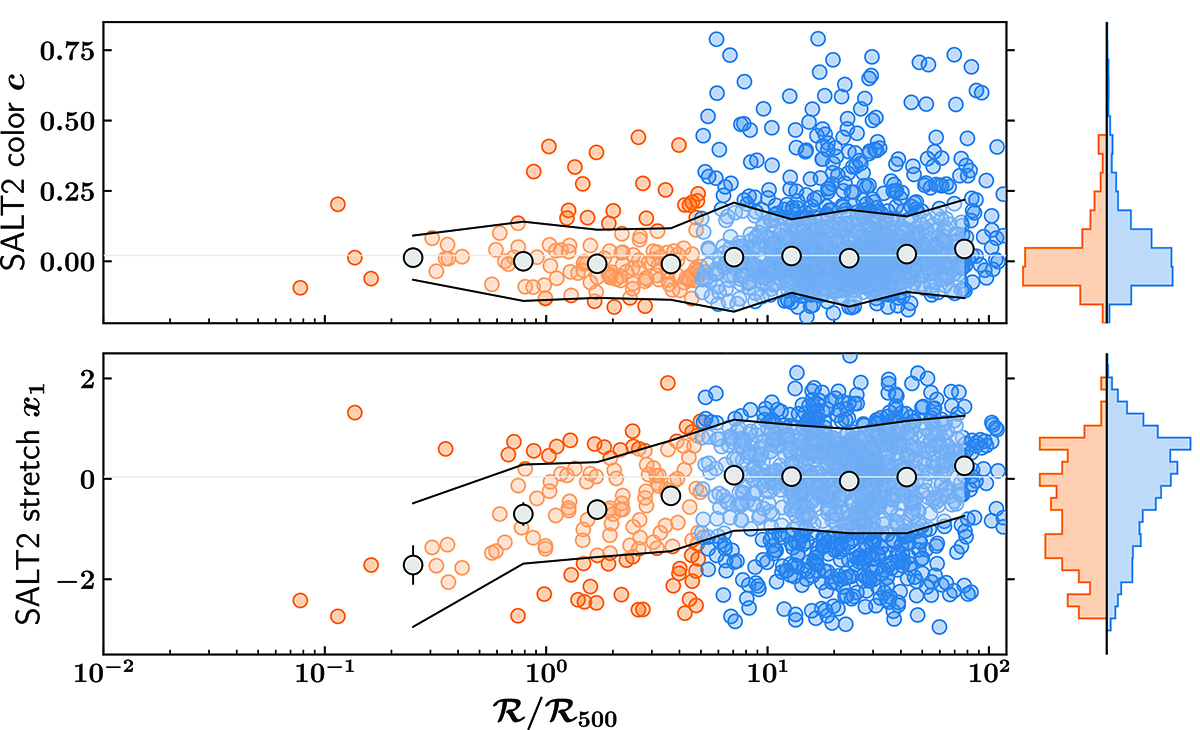
Fig. 3.
Download original image
SALT2 light-curve color (top) and stretch (bottom) as a function of the scaled projected distance to the nearest galaxy cluster (ℛ/ℛ500). We highlight SNe Ia found within (outside) clusters in orange (blue). The right part of each panel shows the projected histogram for each subgroup, leftward (rightward) for SNe Ia within (outside) clusters. The mean stretch and color values (and scatter) per bin of ℛ/ℛ500 are shown as gray markers (running bands). The error bars associated with these markers are the error on the mean.
Current usage metrics show cumulative count of Article Views (full-text article views including HTML views, PDF and ePub downloads, according to the available data) and Abstracts Views on Vision4Press platform.
Data correspond to usage on the plateform after 2015. The current usage metrics is available 48-96 hours after online publication and is updated daily on week days.
Initial download of the metrics may take a while.