Open Access
Fig. 1.
Download original image
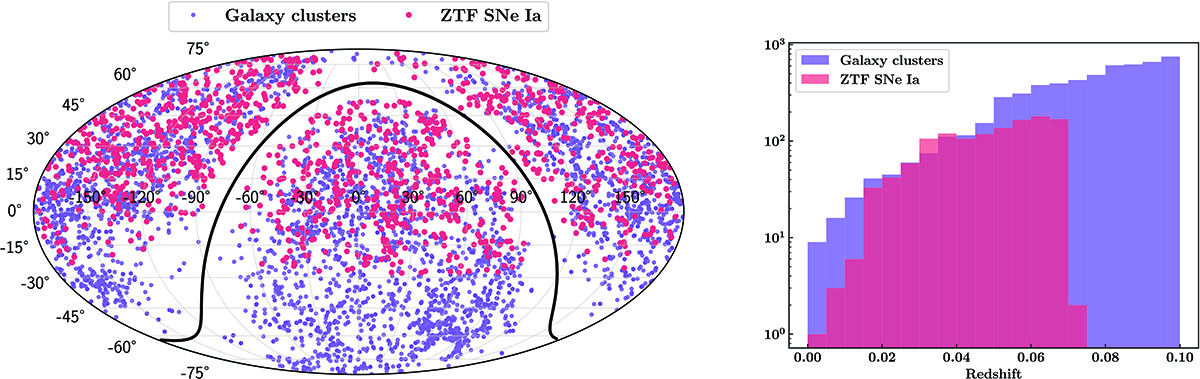
Spatial distribution of the SN Ia and cluster samples. Left: Skymap displaying the equatorial coordinates of each object in the cluster (purple) and SN Ia (red) samples. The black line gives the location of the Milky Way in this projection. Right: redshift distributions of the cluster and SN Ia targets.
Current usage metrics show cumulative count of Article Views (full-text article views including HTML views, PDF and ePub downloads, according to the available data) and Abstracts Views on Vision4Press platform.
Data correspond to usage on the plateform after 2015. The current usage metrics is available 48-96 hours after online publication and is updated daily on week days.
Initial download of the metrics may take a while.