Open Access
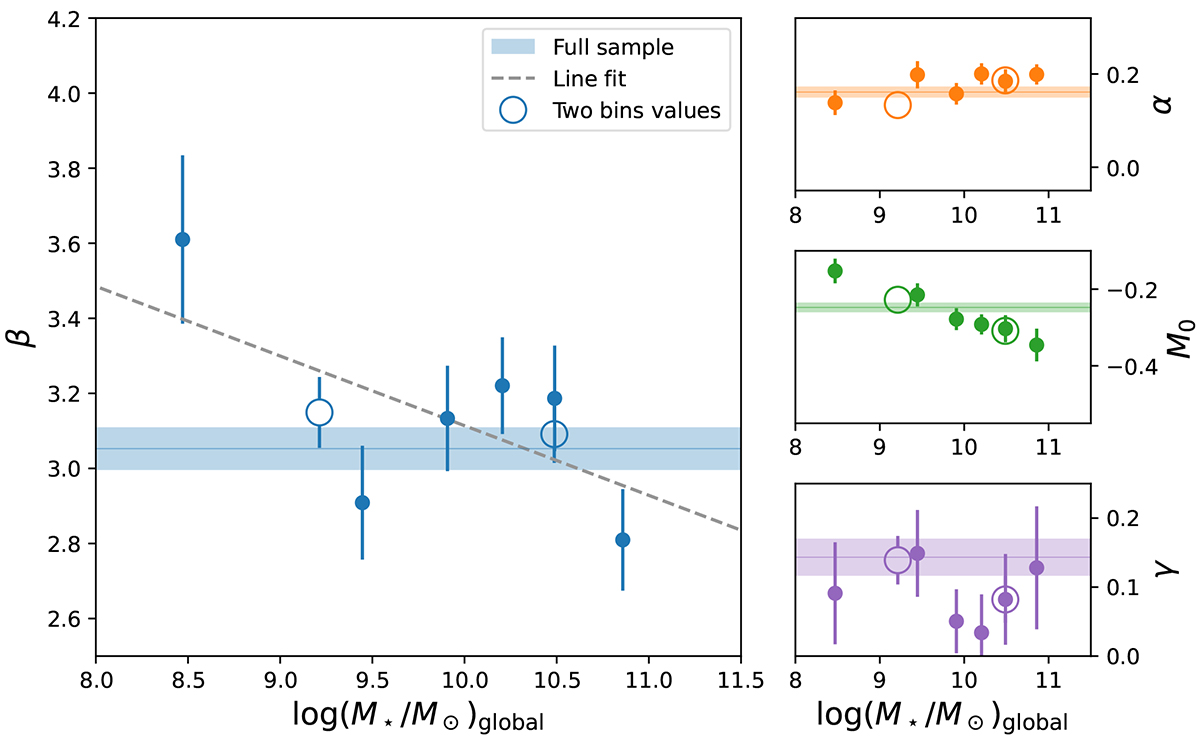
Fig. 5.
Download original image
β, α, M0, and the local colour step γ for each of the global mass bins. The shaded band shows the 1σ error around the fitted value for the full sample. The open points are values for when the sample is cut into two.
Current usage metrics show cumulative count of Article Views (full-text article views including HTML views, PDF and ePub downloads, according to the available data) and Abstracts Views on Vision4Press platform.
Data correspond to usage on the plateform after 2015. The current usage metrics is available 48-96 hours after online publication and is updated daily on week days.
Initial download of the metrics may take a while.