Fig. 9
Download original image
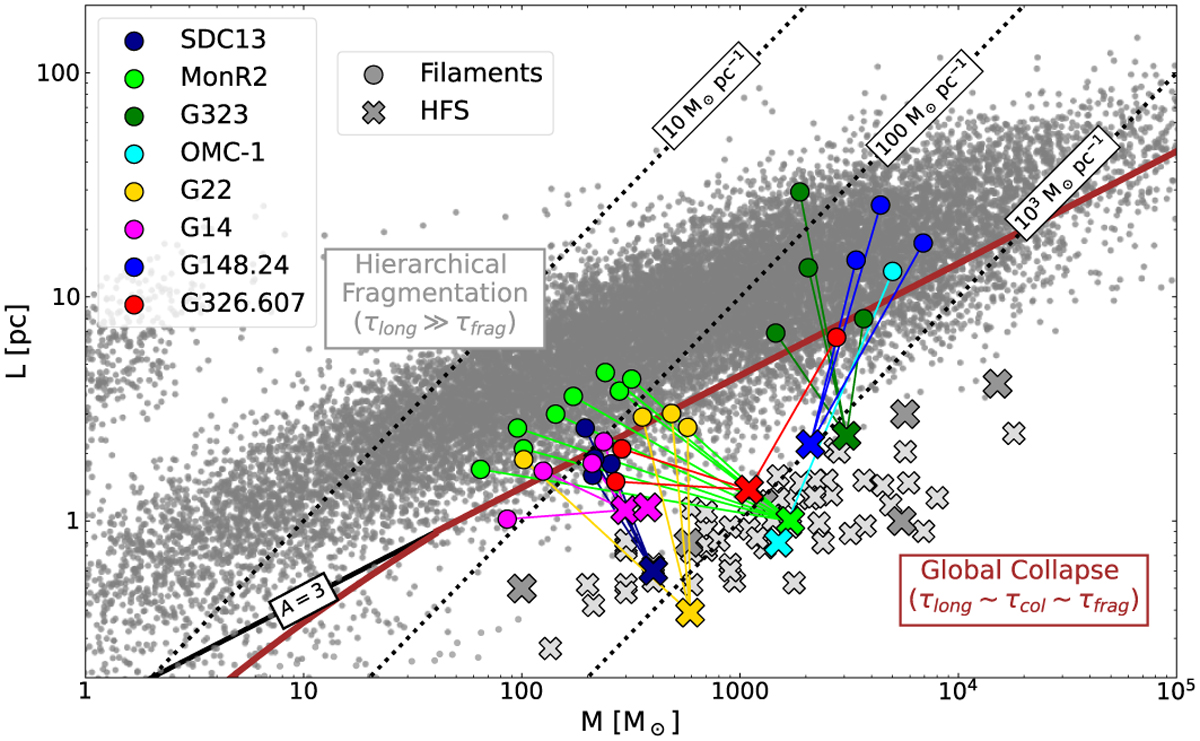
M–L plot comparing those HFS (crosses) with their pc-scale filaments (circles). Individual regions, where filaments and HFS are connected by segments, are color coded in the plot (see legend; see references in Table A.1). Lines and labels are similar to Fig. 7. We highlight different diagonal lines defining individual m = M/L values (=[10,100,100] M⊙ pc−1; dotted black lines).
Current usage metrics show cumulative count of Article Views (full-text article views including HTML views, PDF and ePub downloads, according to the available data) and Abstracts Views on Vision4Press platform.
Data correspond to usage on the plateform after 2015. The current usage metrics is available 48-96 hours after online publication and is updated daily on week days.
Initial download of the metrics may take a while.