Fig. 8
Download original image
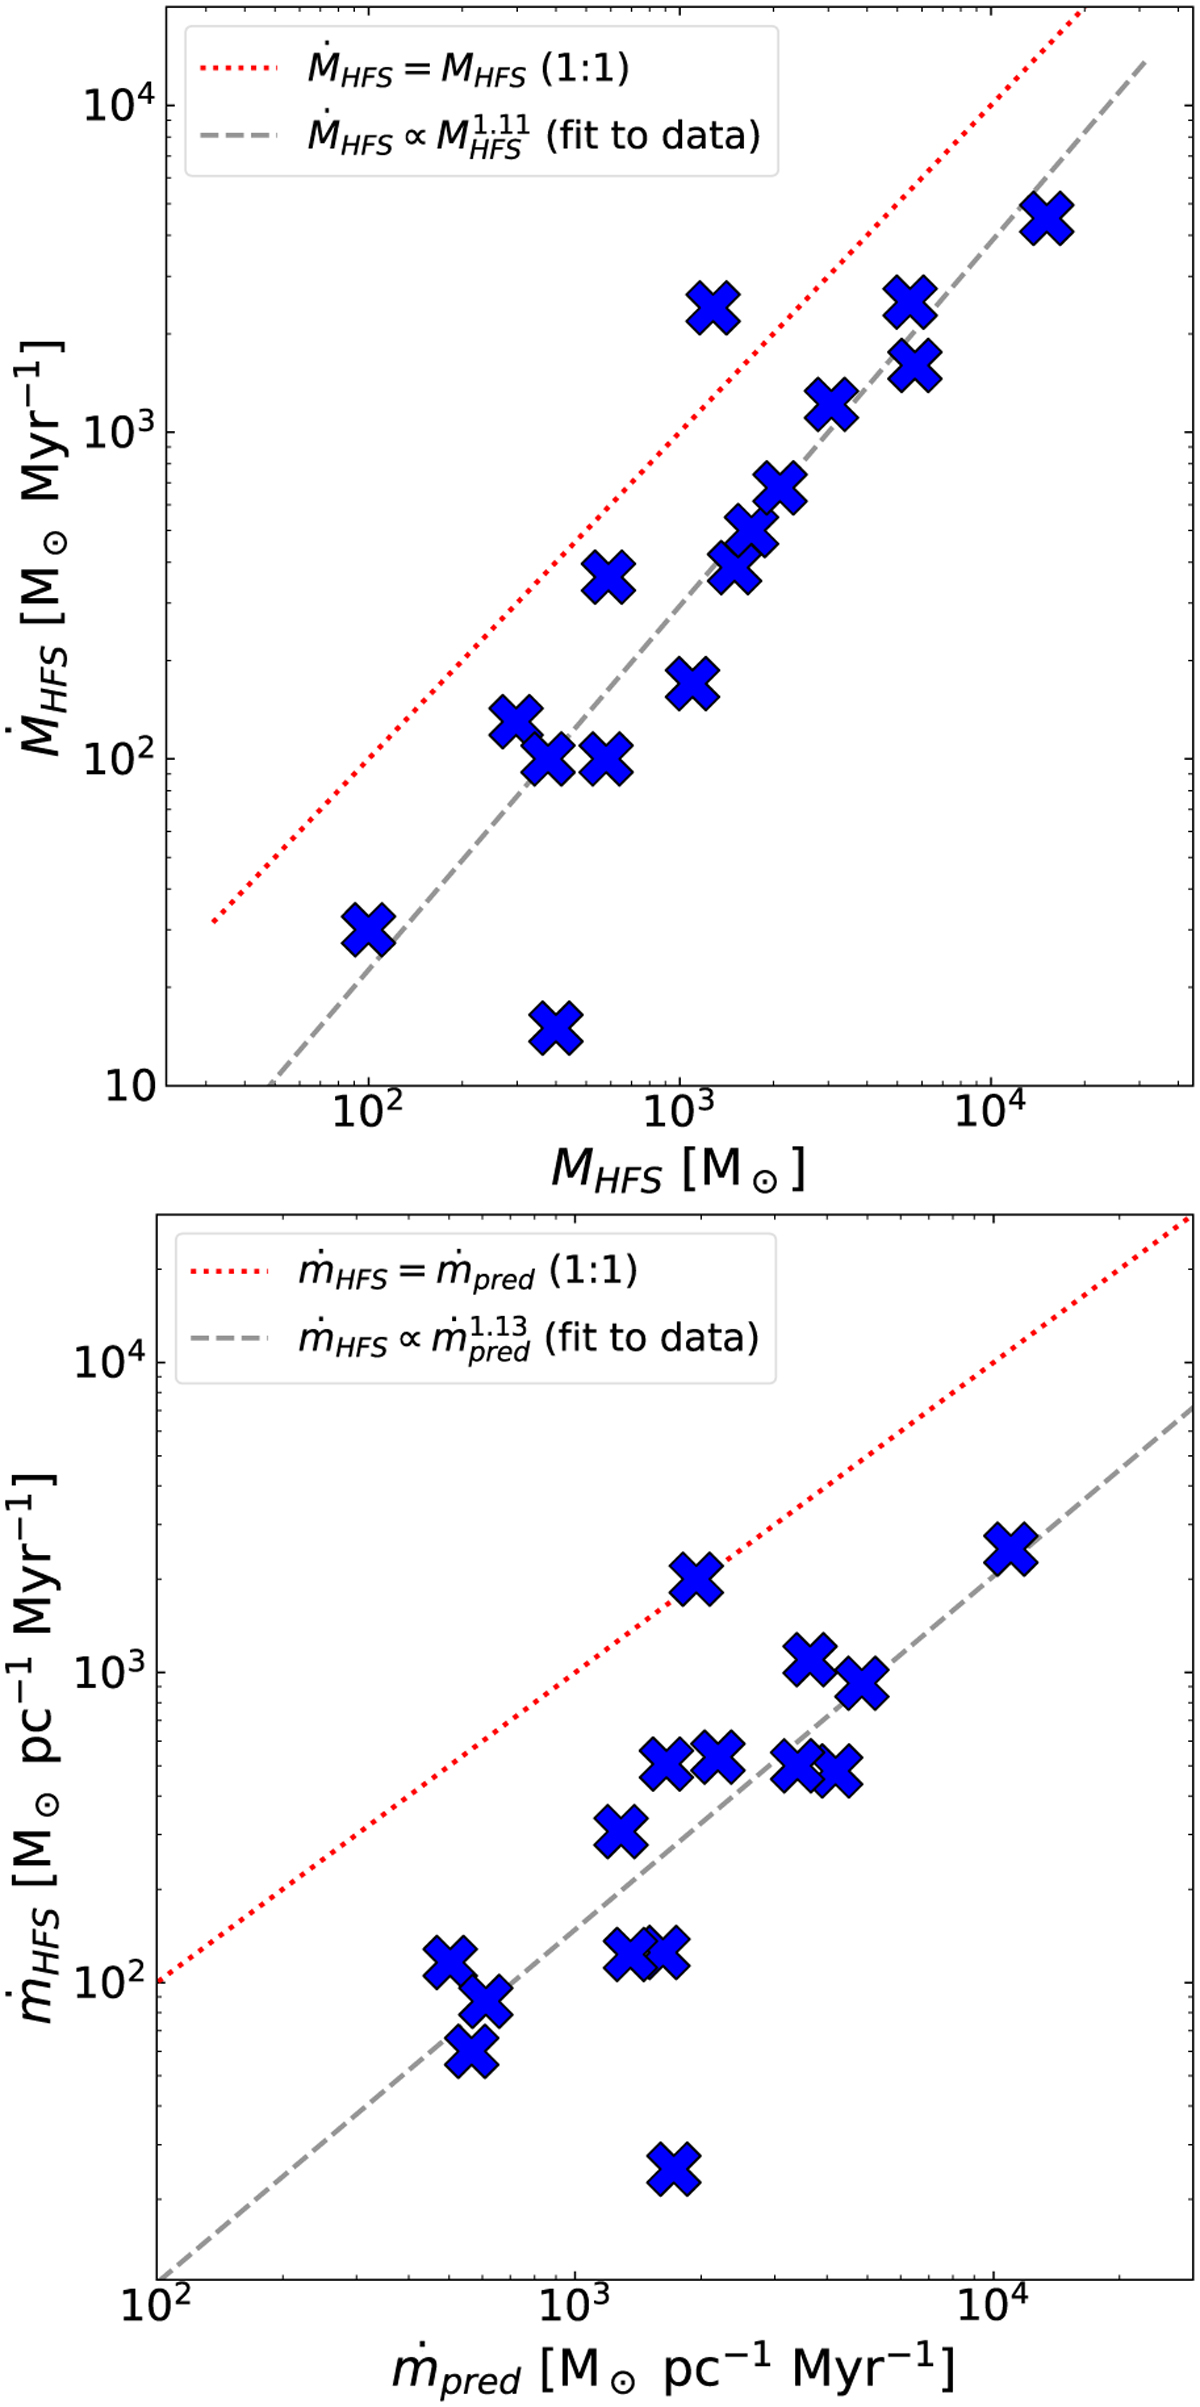
Accretion rates in HFS. Upper panel: comparison between observed total accretion rates (ṀHFS) and the HFS mass (MHFS) reported in the literature for HFS (see also Table A.1). Lower panel: comparison between observed accretion rates per-unit-length (ṁHFS) and those predicted following Eq. (19) (ṁpred). A red dotted line shows the expected 1:1 correlation between these values. A grey dashed line indicates a fit to the data (in log-log space) in both panels (see legend).
Current usage metrics show cumulative count of Article Views (full-text article views including HTML views, PDF and ePub downloads, according to the available data) and Abstracts Views on Vision4Press platform.
Data correspond to usage on the plateform after 2015. The current usage metrics is available 48-96 hours after online publication and is updated daily on week days.
Initial download of the metrics may take a while.