Fig. 7
Download original image
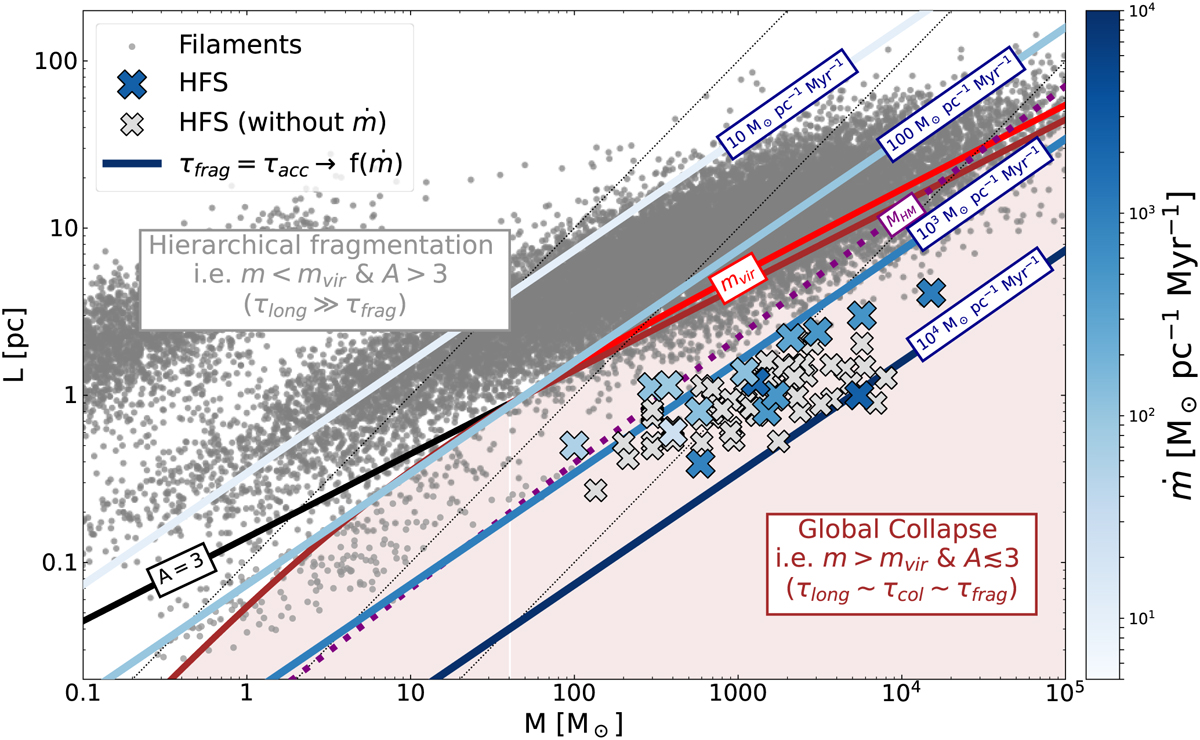
Μ–L plot similar to Fig. 1, this time showing curves where τfraɡ = τacc for different accretion rates, namely ṁ = [10,100,103,104] M⊙ pc−1 Myr−1 (straight blue lines), using different colors (see individual labels and color bar). We display those HFS with accretion measurements using the same color-code (see color bar on the right). We highlight the region with expected global (radial + longitudinal) collapse (shaded brown area; where τlonɡ ~ τff ~ τfraɡ) corresponding to the area where both spheroidal (A ≤ 3; black line) and supervirial (m > mυir; red curve) conditions are satisfied (see also Fig. 2).
Current usage metrics show cumulative count of Article Views (full-text article views including HTML views, PDF and ePub downloads, according to the available data) and Abstracts Views on Vision4Press platform.
Data correspond to usage on the plateform after 2015. The current usage metrics is available 48-96 hours after online publication and is updated daily on week days.
Initial download of the metrics may take a while.