Open Access
Fig. 5
Download original image
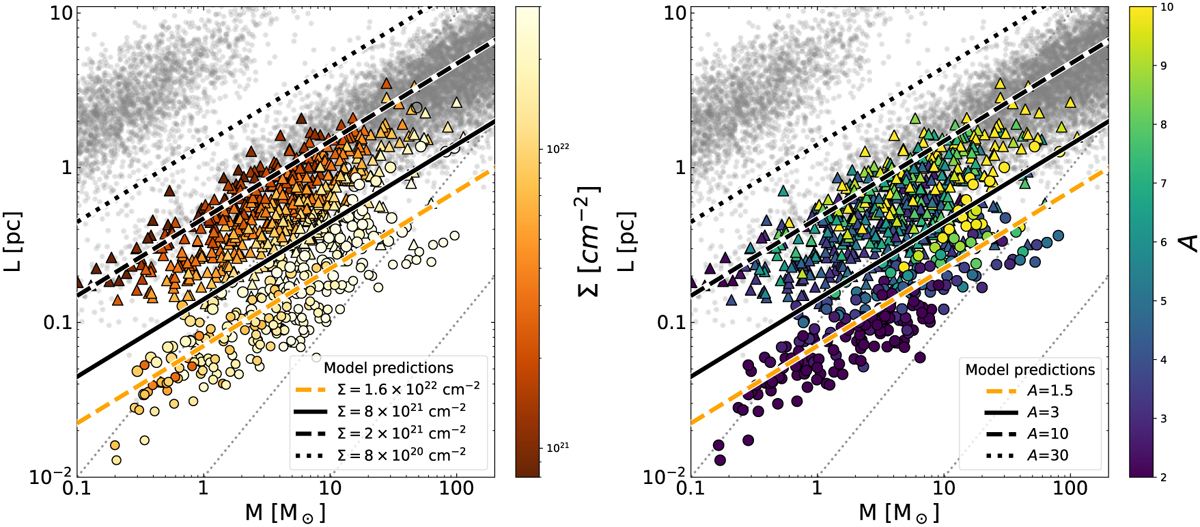
M–L distribution of the nearby HGBS filaments (triangles; Arzoumanian et al. 2019, ; priv. commun.) and fibers (circles Hacar et al. 2023; Socci et al. 2024a,b) color-coded by their mean column density Σ (left panel) and aspect ratio A (right panel). Labels and lines are similar to those in Fig. 4.
Current usage metrics show cumulative count of Article Views (full-text article views including HTML views, PDF and ePub downloads, according to the available data) and Abstracts Views on Vision4Press platform.
Data correspond to usage on the plateform after 2015. The current usage metrics is available 48-96 hours after online publication and is updated daily on week days.
Initial download of the metrics may take a while.