Fig. 4
Download original image
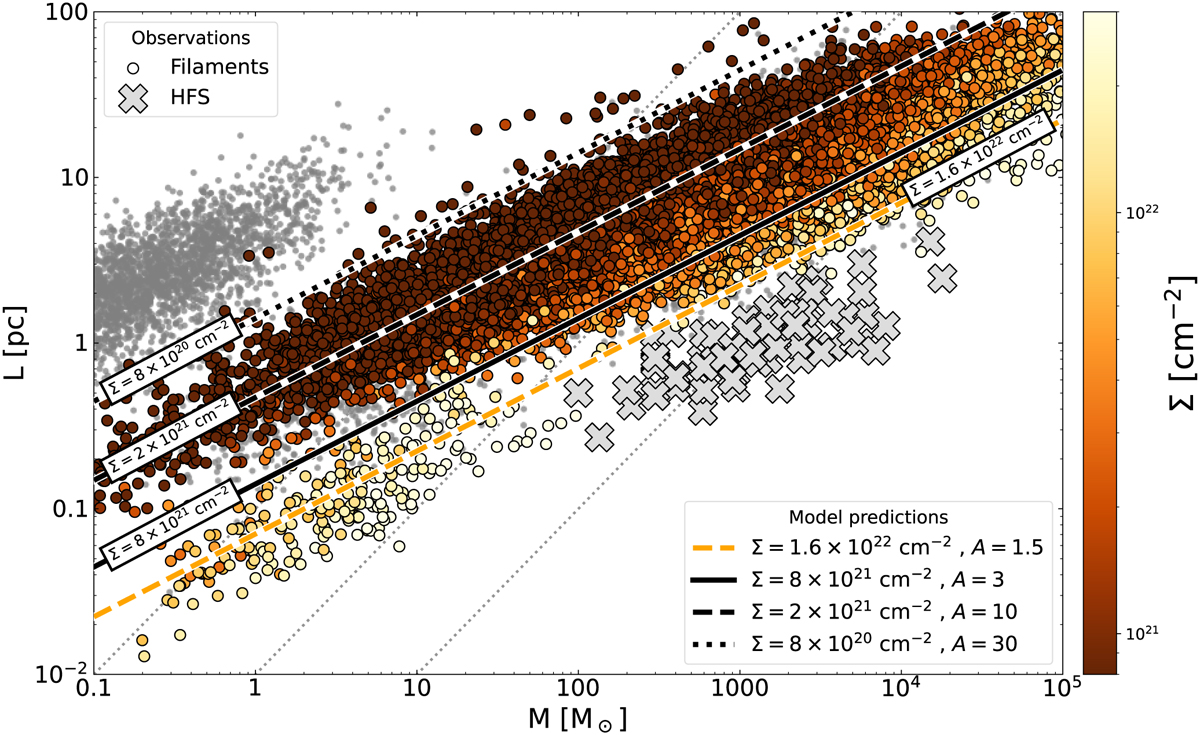
Mass-Length (M-L) distribution of molecular filaments (circles) similar to Fig. 1, this time color-coded by their average column density Σ (see color bar). The majority of these Σ measurements (> 18 000) were obtained by the Hi-GAL survey (Schisano et al. 2020), while a few additional datapoints (152) have been taken from our Paper III (Socci et al. 2024a). Analogously to Fig. 2, the different lines indicate the predicted distribution of filaments with a mean column density of Σ = [0.8, 2, 8, 16] ⋅ 1021 cm−2 (see legend) according to Eqs. (1) and (11). This corresponds to aspect ratios of A = [30, 10, 3, 1.5], respectively, following Eq. (10). The location of all HFS (grey crosses) are indicated in this plot for comparison. We note that the position of the HFS would correspond with the expected location for prolate (A ≲ 1.5) and high-column density (Σ > 1022 cm−2) structures according to the predictions of our model. See also Fig. C.1.
Current usage metrics show cumulative count of Article Views (full-text article views including HTML views, PDF and ePub downloads, according to the available data) and Abstracts Views on Vision4Press platform.
Data correspond to usage on the plateform after 2015. The current usage metrics is available 48-96 hours after online publication and is updated daily on week days.
Initial download of the metrics may take a while.