Fig. 3
Download original image
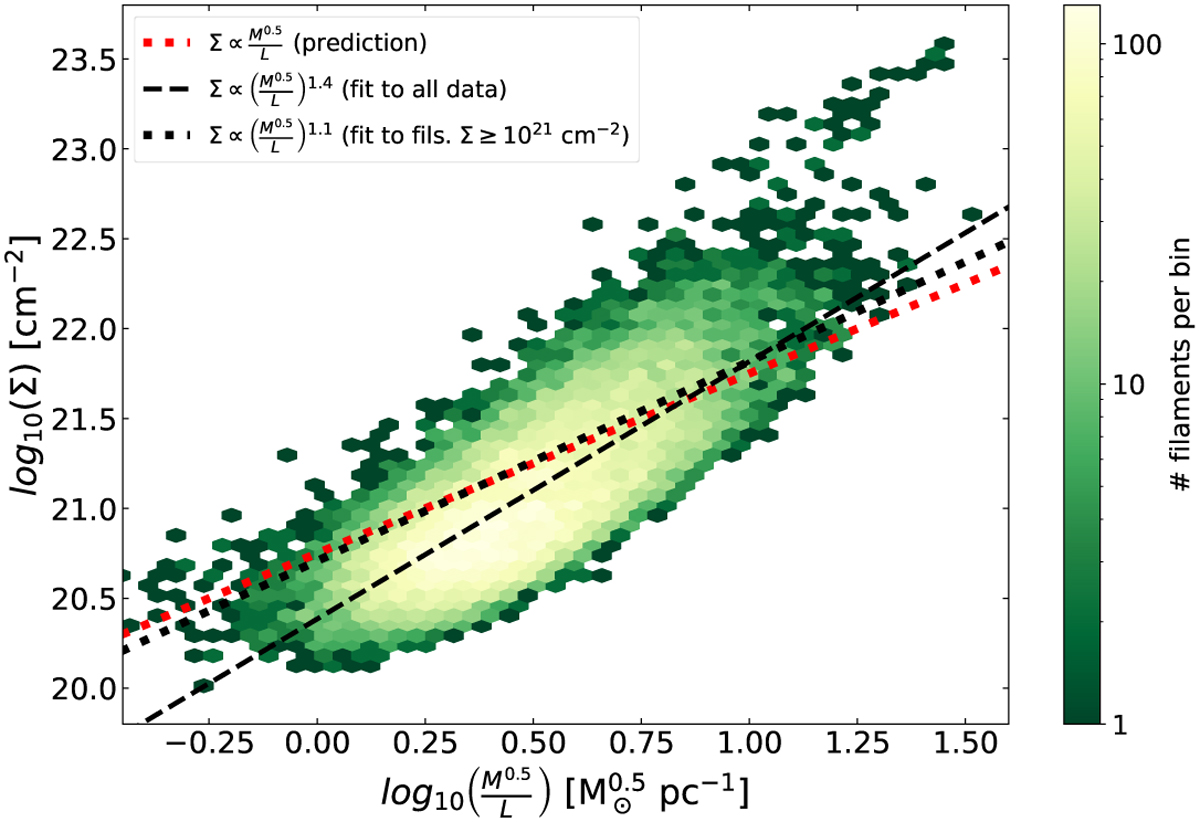
Comparison between the average column density Σ and the M0.5/L ratio observed in the Hi-GAL filaments (> 18 000 filaments; Schisano et al. 2020) displayed using a hexagonal 2D density plot (see color bar). Overplotted on these data, we display the prediction from Eq. (12) (dotted red line) as well as different fits to the data (dashed and dotted black lines; see legend).
Current usage metrics show cumulative count of Article Views (full-text article views including HTML views, PDF and ePub downloads, according to the available data) and Abstracts Views on Vision4Press platform.
Data correspond to usage on the plateform after 2015. The current usage metrics is available 48-96 hours after online publication and is updated daily on week days.
Initial download of the metrics may take a while.