Fig. 2
Download original image
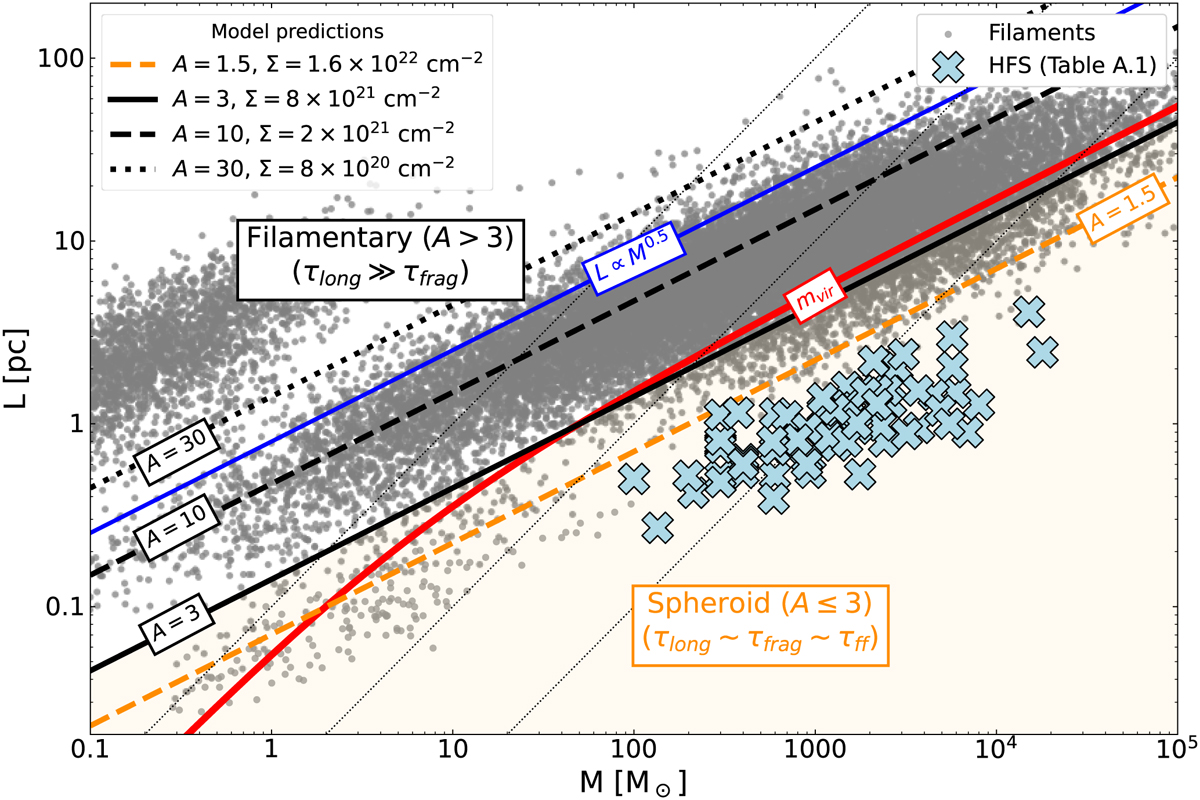
Model predictions (Sect. 2.3) compared to the location of the ISM filaments in the M–L phase space (see also Fig. 1). For simplicity, we display only those molecular filaments. Using Eq. (10), different lines indicate the expected normalization values for characteristic filamentary (A = 30, 10, and 3; black lines) and prolate spheroids (A < 3, orange shaded area) geometries. We added also the typical A observed for HFS (A ≤ 1.5; orange dashed line; e.g., Kumar et al. 2020). We also indicate their corresponding surface densities according to Eq. (11) in the legend.
Current usage metrics show cumulative count of Article Views (full-text article views including HTML views, PDF and ePub downloads, according to the available data) and Abstracts Views on Vision4Press platform.
Data correspond to usage on the plateform after 2015. The current usage metrics is available 48-96 hours after online publication and is updated daily on week days.
Initial download of the metrics may take a while.