Fig. 10
Download original image
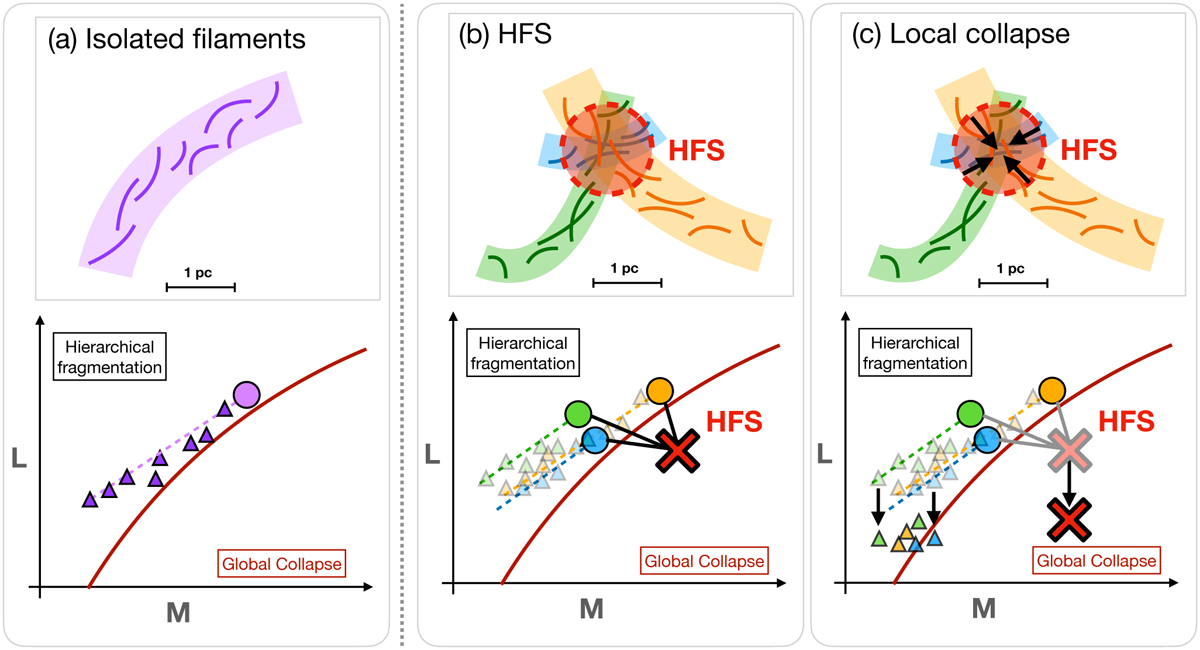
Illustrative cartoon describing the configuration (top panels) and location of filaments and HFS in the M–L phase space (bottom panels). From left to right: (a) hierarchical fragmentation of isolated filaments (circles) into sub-filaments (triangles); (b) formation of a HFS system at the intersection of multiple filaments; and (c) local gravitational collapse of the resulting parsec-scale clump. Black arrows indicate how this collapse may lead into the shrink of both the central clump and subfilaments in the HFS moving these objects downwards in the M–L phase space. Similarly to Fig. 8, a brown line in these plots indicates the transition between hierarchical fragmentation (above the line) and global collapse (beneath the line).
Current usage metrics show cumulative count of Article Views (full-text article views including HTML views, PDF and ePub downloads, according to the available data) and Abstracts Views on Vision4Press platform.
Data correspond to usage on the plateform after 2015. The current usage metrics is available 48-96 hours after online publication and is updated daily on week days.
Initial download of the metrics may take a while.