Fig. 1
Download original image
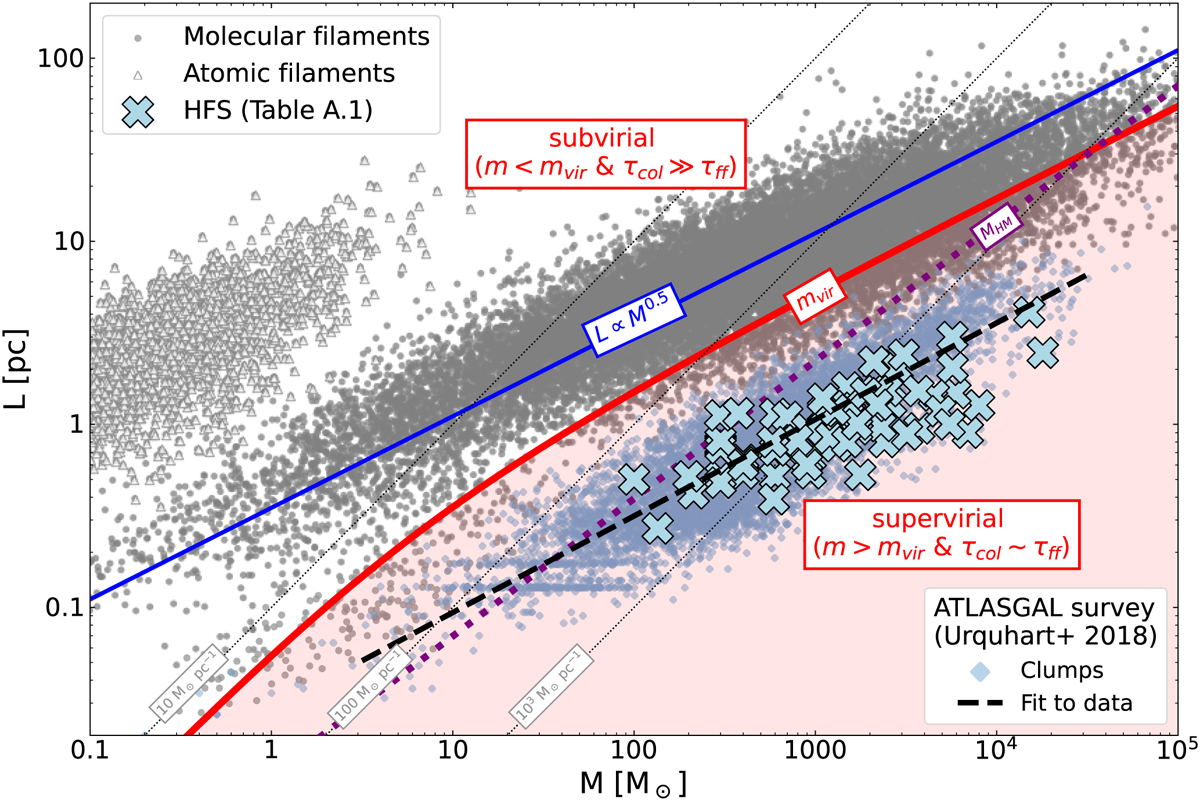
Distribution of molecular (grey dots) and atomic (HI) filaments (grey triangles) in the M–L phase space. Most data are taken from all the public surveys included in Hacar et al. (2023) (and references therein) plus some additional values from Socci et al. (2024a). Superposed to our data, we also display the M-L distribution of ATLASGAL clumps (Urquhart et al. 2018, light blue diamonds; with L = 2 × RAGAL in our notation) and their corresponding power-law fit (dashed black line). HFS are also highlighted in this plot (blue crosses; Table A.1). Overall, most filaments follow a M-L scaling relation such as L ∝ M0.5 (dotted blue line). We indicate the virial line mass mvir for equipartition reported for filaments which separates the subvirial and supervirial regimes (solid red line; Eq. (5)) as well as lines of constant line mass m = [10, 100, 103] M⊙ pc−1 (dotted grey lines). We also include the mass threshold for high-mass star formation MHM = 870 M⊙ ⋅ (Reff /pc)1.33 (dotted purple line; Kauffmann & Pillai 2010), for which we assumed L = 2 × Reff.
Current usage metrics show cumulative count of Article Views (full-text article views including HTML views, PDF and ePub downloads, according to the available data) and Abstracts Views on Vision4Press platform.
Data correspond to usage on the plateform after 2015. The current usage metrics is available 48-96 hours after online publication and is updated daily on week days.
Initial download of the metrics may take a while.