Fig. 9
Download original image
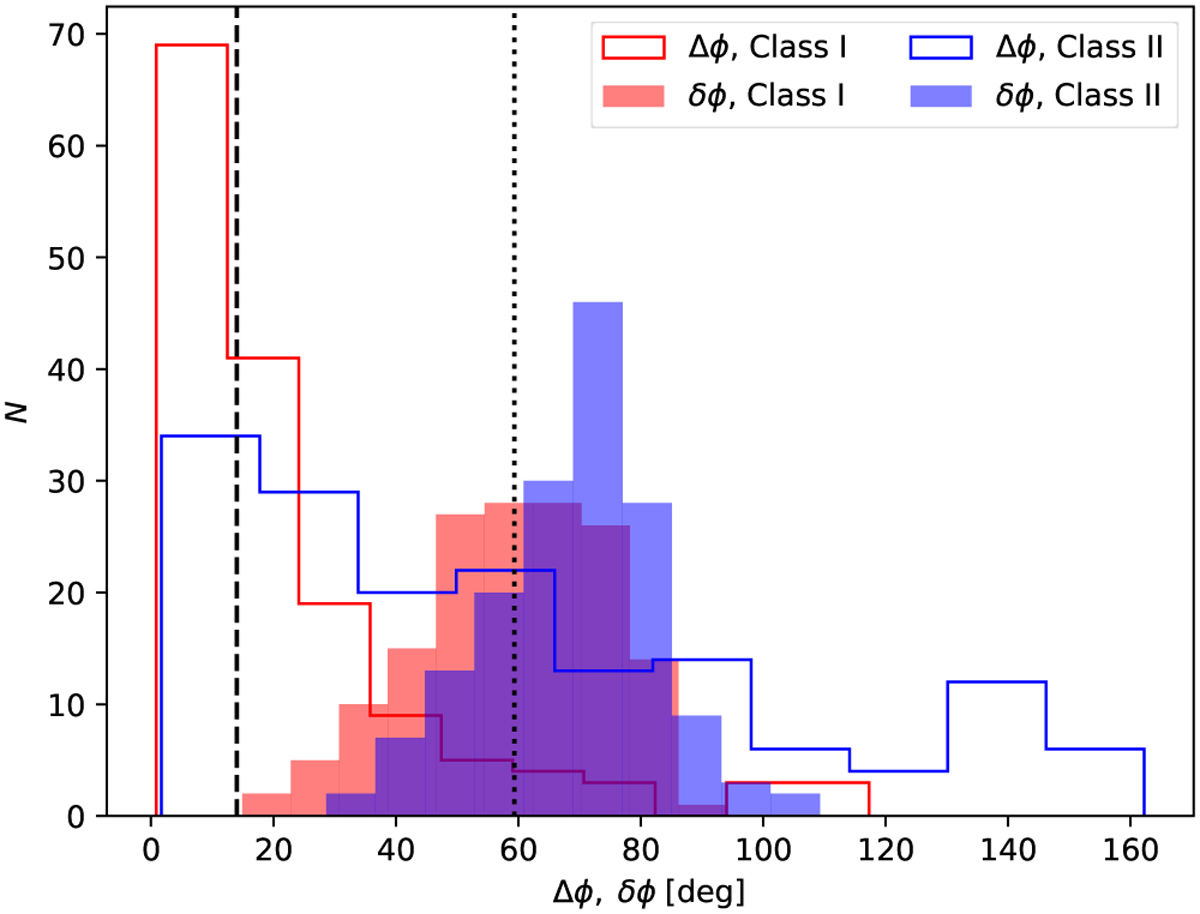
Histograms of the last ∆ϕ (red step histogram) and of the last δϕ (red-shaded bar histogram), for class I and earlier protostars. The median values of ∆ϕ and δϕ are shown by the black dashed and dotted vertical lines, respectively. For comparison, the corresponding histograms for class II stars from Fig. 7 have been replotted here in blue.
Current usage metrics show cumulative count of Article Views (full-text article views including HTML views, PDF and ePub downloads, according to the available data) and Abstracts Views on Vision4Press platform.
Data correspond to usage on the plateform after 2015. The current usage metrics is available 48-96 hours after online publication and is updated daily on week days.
Initial download of the metrics may take a while.