Fig. 8
Download original image
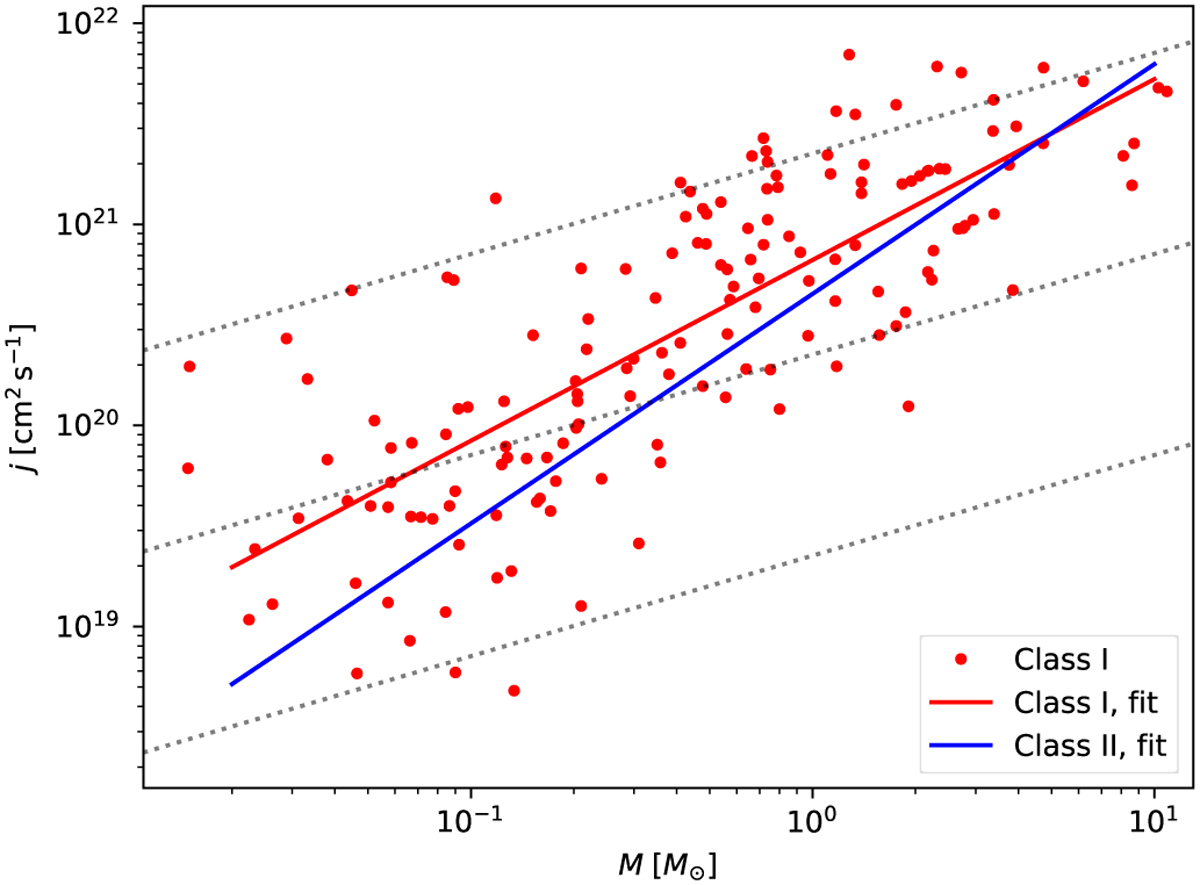
Scatter plot of the specific angular momentum versus mass in the last epoch of the class I and earlier protostars. The red line is the leastsquares fit (log y = (0.90 ± 0.06) log x+ (20.8 ± 0.04)) to the data points, while the blue line is the fit to the simulated class II stars from Figure 6. The gray dotted lines are the specific angular momentum for a given disk radius (1, 100, and 10 000 au, with increasing j) as a function of stellar mass, using Eq. (29) in Padoan et al. (2025) for Keplerian disks.
Current usage metrics show cumulative count of Article Views (full-text article views including HTML views, PDF and ePub downloads, according to the available data) and Abstracts Views on Vision4Press platform.
Data correspond to usage on the plateform after 2015. The current usage metrics is available 48-96 hours after online publication and is updated daily on week days.
Initial download of the metrics may take a while.