Fig. 5
Download original image
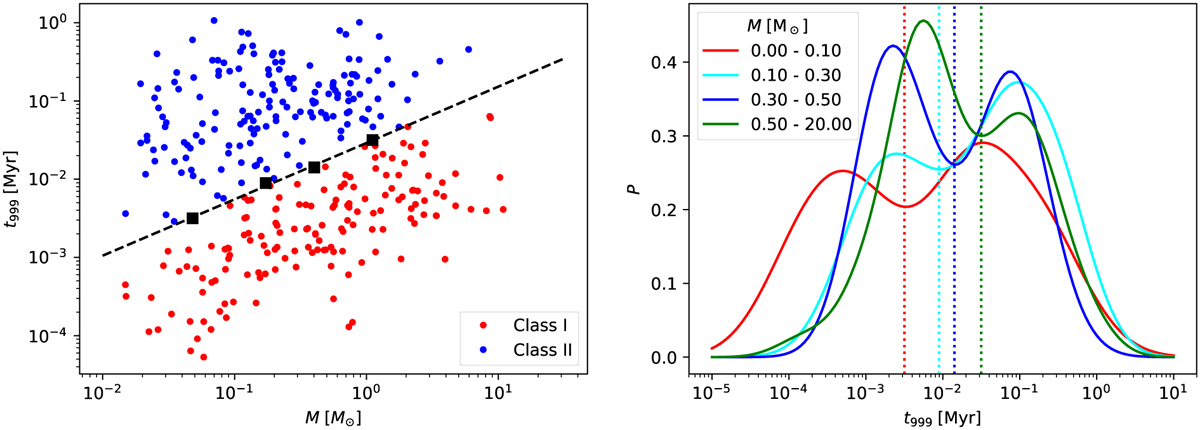
Scatter plot of the formation time of 90% of the last epoch (t999) versus mass on the left, and kernel density estimator (KDE) probability density plots of the formation time in four bins of final stellar mass on the right. We find the local minima of the KDE functions, which are then plotted on the scatter plot as black squares. The black dashed line is a fit to the black squares, log y = 0.72 ± 0.03 log x − 1.54 ± 0.03. This line is used to separate the sinks fed by slower Bondi-Hoyle accretion (blue points) and sinks accreting at a much higher rate, likely still in the class I or even earlier protostellar phases (red points).
Current usage metrics show cumulative count of Article Views (full-text article views including HTML views, PDF and ePub downloads, according to the available data) and Abstracts Views on Vision4Press platform.
Data correspond to usage on the plateform after 2015. The current usage metrics is available 48-96 hours after online publication and is updated daily on week days.
Initial download of the metrics may take a while.