Fig. 4
Download original image
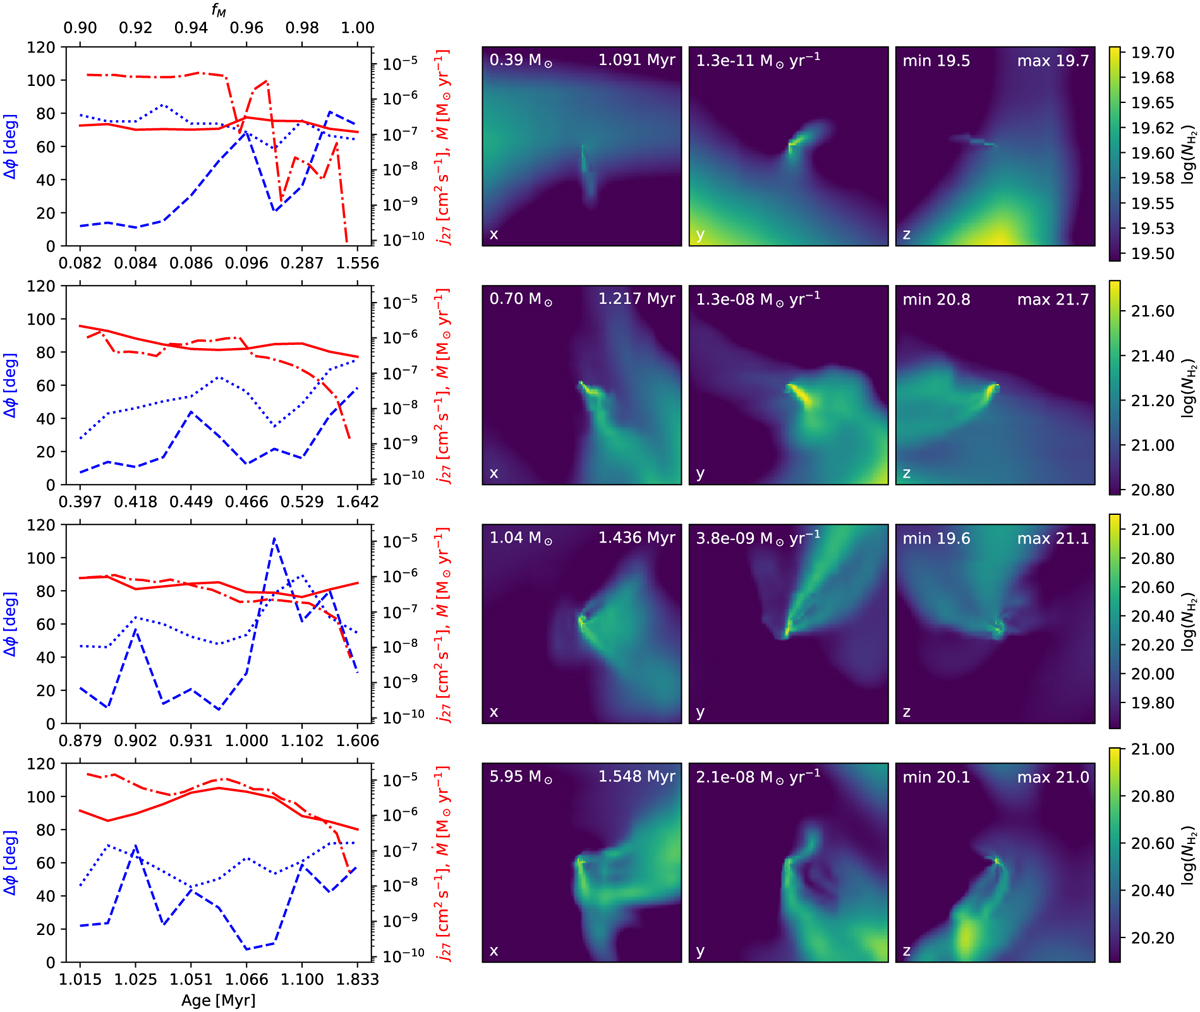
Four example stars (one per row) showing the accretion of the last 10% of their mass on the left (the top x-axis is the mass fraction, fM, and the bottom x-axis is the corresponding age of the star), and their late-accretion flows on the right. Left column: Angle ∆ϕ (dashed blue line, “disk-to-disk” misalignment), angle δϕ (dotted blue line, “tracers-to-disk” dispersion), specific angular momentum of the epoch (solid red line), j27 = j × 10−27, and the median accretion rate within 0.5% massbins (dash-dotted red line), Ṁ. Right column: Column density images of log(![]() ) in a 6400 au box, from three different cardinal directions (xyz), using the middle snapshot of the last epoch for each of the stars. The text in the images list the final mass, the age and the average accretion rate at this snapshot, and the minimum and the maximum limits used for the colorscale of the logarithm images, in all directions.
) in a 6400 au box, from three different cardinal directions (xyz), using the middle snapshot of the last epoch for each of the stars. The text in the images list the final mass, the age and the average accretion rate at this snapshot, and the minimum and the maximum limits used for the colorscale of the logarithm images, in all directions.
Current usage metrics show cumulative count of Article Views (full-text article views including HTML views, PDF and ePub downloads, according to the available data) and Abstracts Views on Vision4Press platform.
Data correspond to usage on the plateform after 2015. The current usage metrics is available 48-96 hours after online publication and is updated daily on week days.
Initial download of the metrics may take a while.