Fig. 3
Download original image
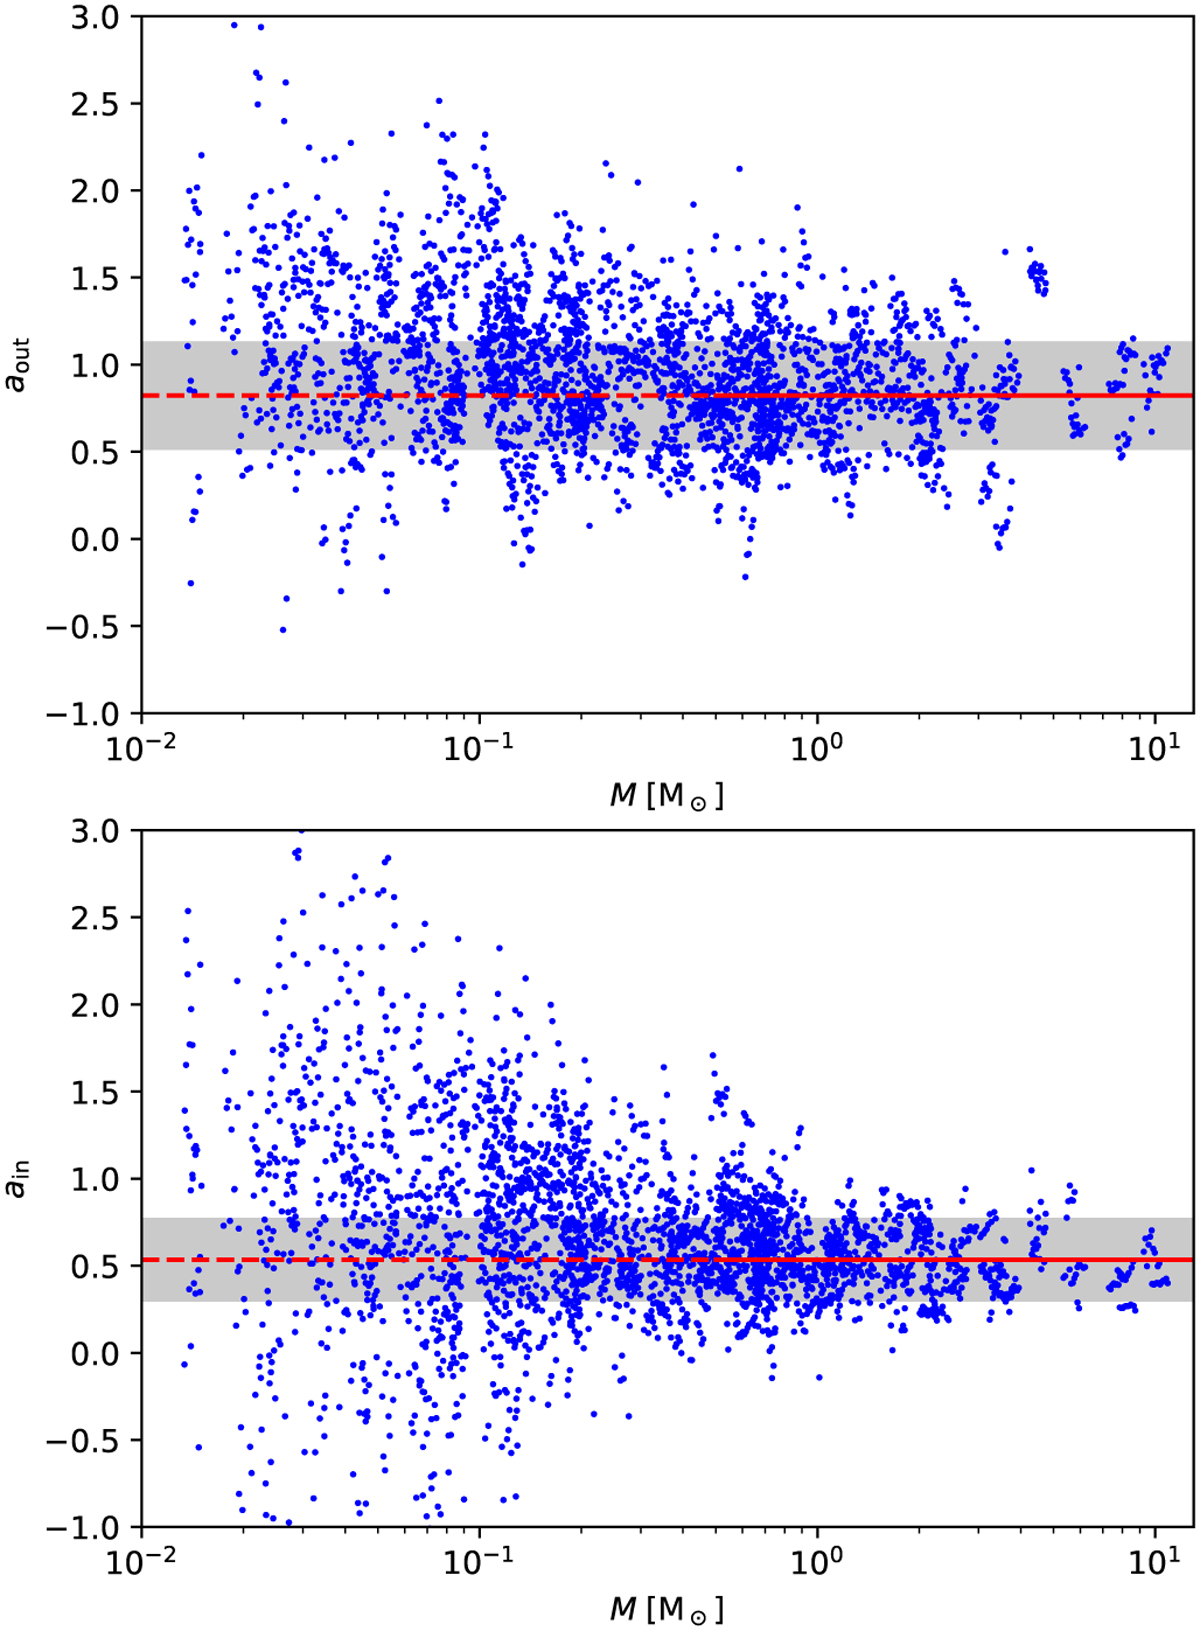
Power-law slope of jtr versus rtr, ![]() , averaged for all the tracer particles within a single epoch, versus the final stellar mass (blue dots), as explained in the main text. The upper panel is for the scaling outside of RBH, the lower panel for the scaling inside RBH. The red lines show the median slope values aout = 0.82 (upper panel) and ain = 0.53 (lower panel, computed over masses ≥0.5 M⊙), and the shaded regions the rms value around the median.
, averaged for all the tracer particles within a single epoch, versus the final stellar mass (blue dots), as explained in the main text. The upper panel is for the scaling outside of RBH, the lower panel for the scaling inside RBH. The red lines show the median slope values aout = 0.82 (upper panel) and ain = 0.53 (lower panel, computed over masses ≥0.5 M⊙), and the shaded regions the rms value around the median.
Current usage metrics show cumulative count of Article Views (full-text article views including HTML views, PDF and ePub downloads, according to the available data) and Abstracts Views on Vision4Press platform.
Data correspond to usage on the plateform after 2015. The current usage metrics is available 48-96 hours after online publication and is updated daily on week days.
Initial download of the metrics may take a while.