Fig. 16
Download original image
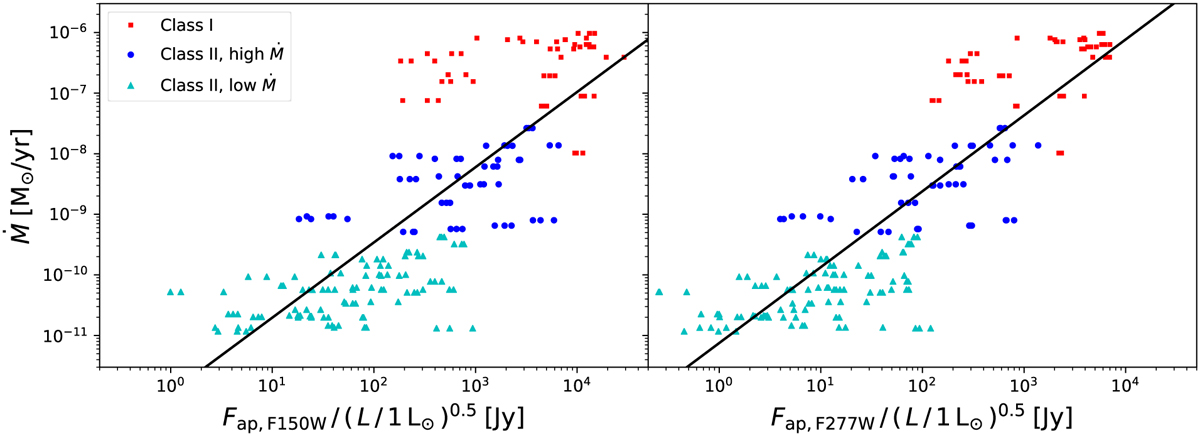
Comparison of the NIR flux density (F150W (left panel) or F277W (right panel) filter, aperture from 250 to 1000 au), divided by the square root of the luminosity of the star in solar luminosities, to the accretion rate. Blue dots (Ṁ ≥ 5 × 10⁻¹⁰ M⊙/yr) and cyan triangles (Ṁ < 5 × 10⁻¹⁰ M⊙/yr) are for the class II stars (local density ≤ 5 × 104 cm−3), and the small red squares are for the class I stars (local density > 5 × 104 cm−3). The black solid line is a least-squares fit giving log y = (1.24 ± 0.07) log x − (11.9 ± 0.18) (F150W, left panel) and log y = (1.25 ± 0.05) log x −(11.1 ± 0.11) (F277W, right panel).
Current usage metrics show cumulative count of Article Views (full-text article views including HTML views, PDF and ePub downloads, according to the available data) and Abstracts Views on Vision4Press platform.
Data correspond to usage on the plateform after 2015. The current usage metrics is available 48-96 hours after online publication and is updated daily on week days.
Initial download of the metrics may take a while.