Fig. 15
Download original image
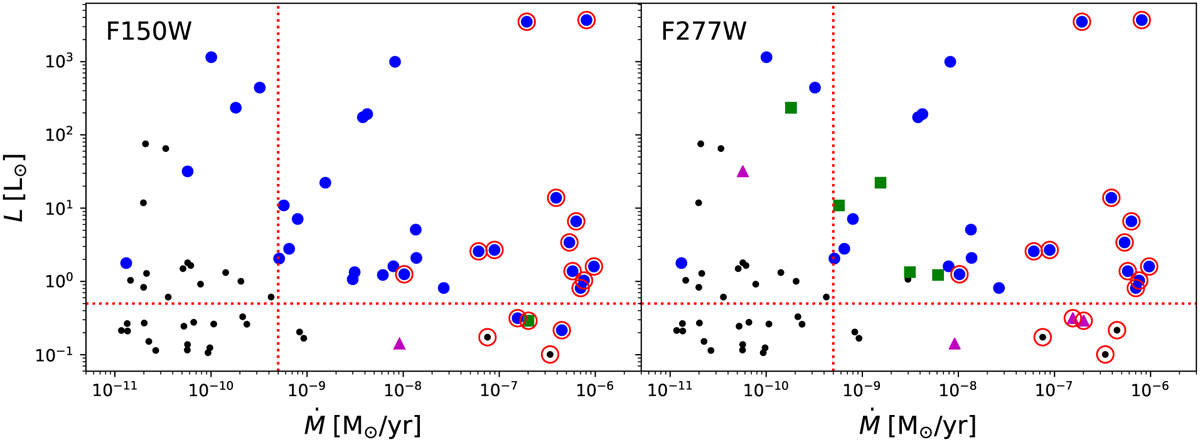
Scatter plots of stellar luminosity versus accretion rate for all the synthetic observations, with symbols and colors referring to the detection rate after 2 min of exposure time with the F150W (left panel) and F277W (right panel) filters. The small black dots correspond to a non-detection of an accretion feature in all three directions (x, y, and z), the magenta triangles detection in only one direction, the green squares detection in two directions, and the large blue dots detection in all three directions. The protostars (class I or earlier) are highlighted by red circles around the markers. The red dotted vertical and horizontal lines mark the thresholds of Ṁ > 5 × 10⁻¹⁰ M⊙/yr and L > 0.5 L⊙, respectively.
Current usage metrics show cumulative count of Article Views (full-text article views including HTML views, PDF and ePub downloads, according to the available data) and Abstracts Views on Vision4Press platform.
Data correspond to usage on the plateform after 2015. The current usage metrics is available 48-96 hours after online publication and is updated daily on week days.
Initial download of the metrics may take a while.