Fig. 13
Download original image
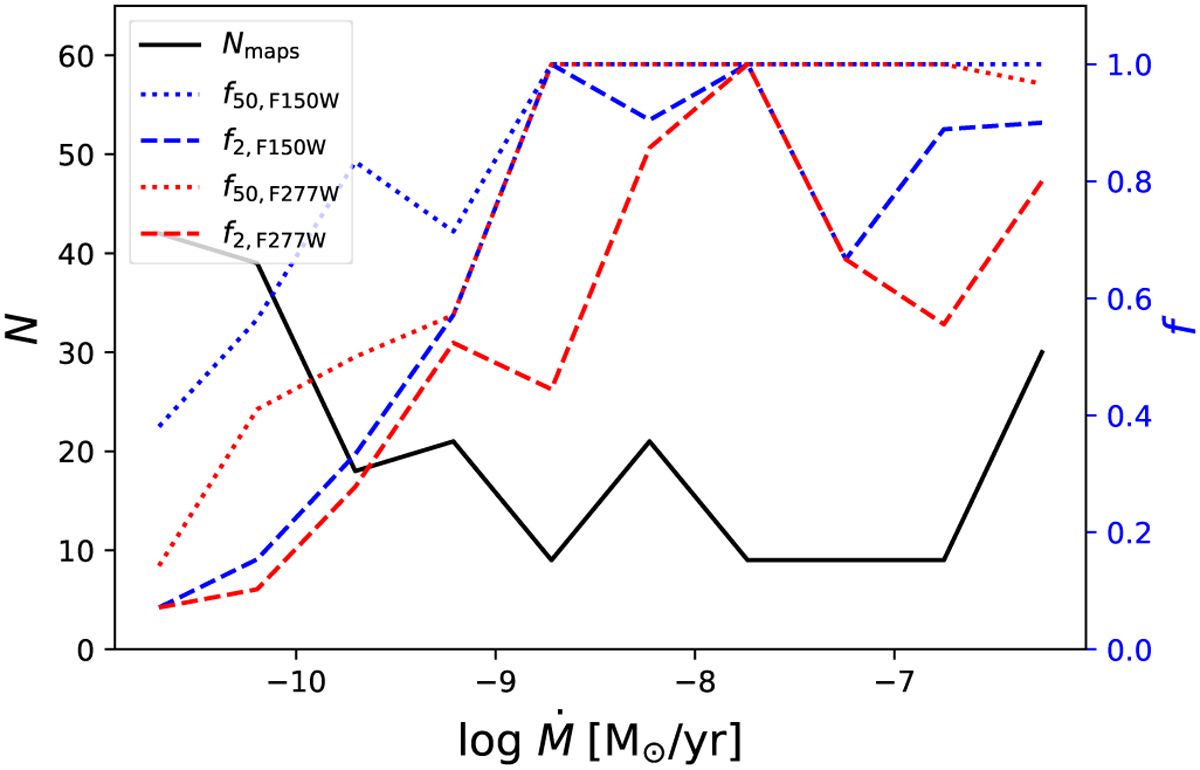
Total number of maps in bins of the accretion rate, and the detection fractions of the maps where accretion features were detected with S/N ≥5σ at least 1000 au from the central star. The black line is the number of all the maps, non-detections included, with y-axis on the left. The colored lines (blue and red for F150W and F277W filters, and dashed and dotted for 2 min and 50 min exposure times, respectively) and the y-axis on the right show the successful detection fraction of the maps.
Current usage metrics show cumulative count of Article Views (full-text article views including HTML views, PDF and ePub downloads, according to the available data) and Abstracts Views on Vision4Press platform.
Data correspond to usage on the plateform after 2015. The current usage metrics is available 48-96 hours after online publication and is updated daily on week days.
Initial download of the metrics may take a while.