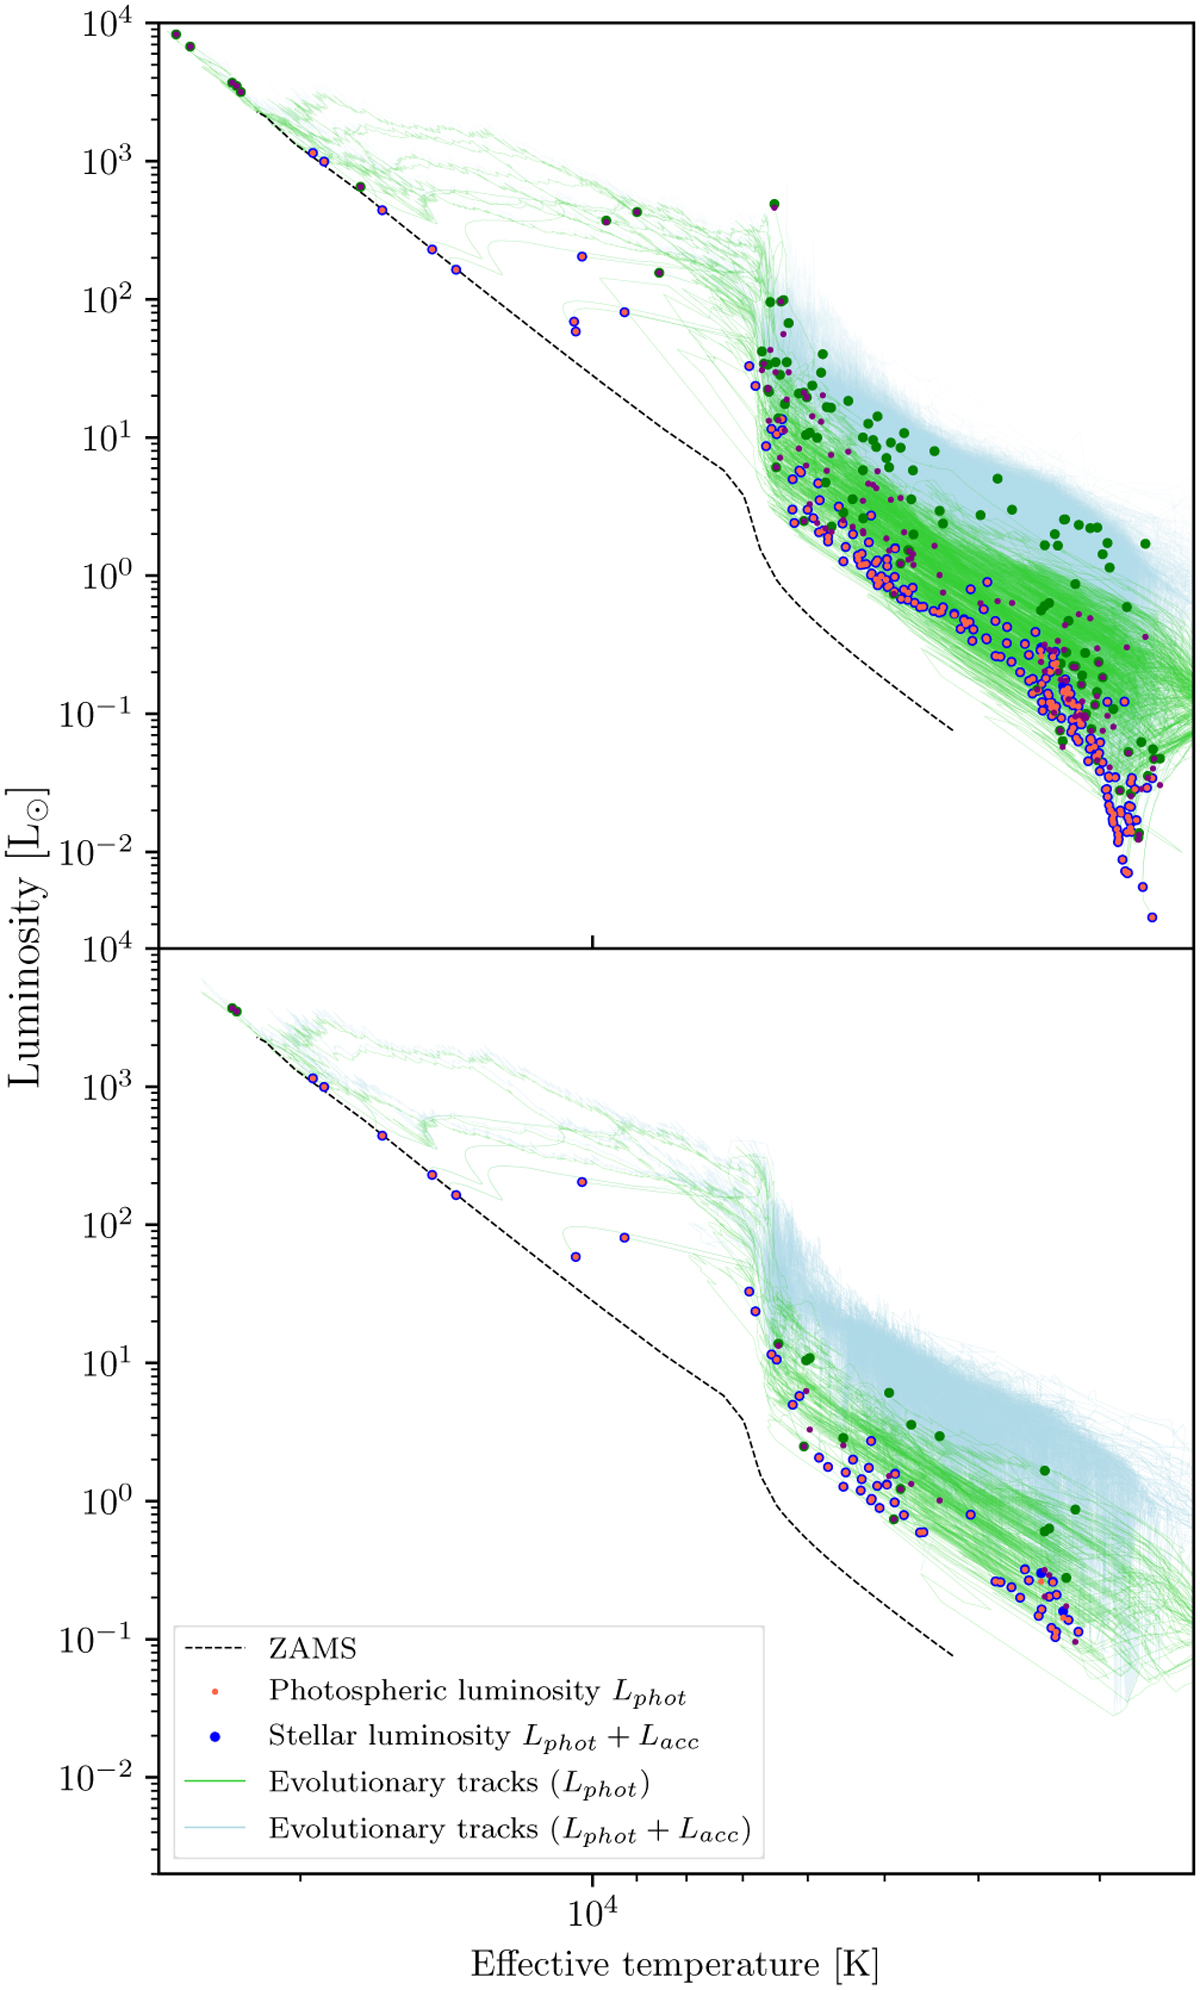
Fig. 10
Download original image
Hertzsprung-Russell diagram for all stars in the last snapshot (top panel) and for the 69 stars in the JWST synthetic observations (bottom panel). The small symbols (magenta and red) are for photospheric luminosities, while the large symbols (green and blue) are for stellar luminosities which include the accretion luminosity. Magenta and green points are class I stars, while red and blue points are class II. When Lacc is small (especially class II stars), the small points overlap with the larger ones, resulting in the appearance of red/magenta points with blue/green borders for class II and class I stars, respectively. The zeroage main sequence is indicated by the dashed black line, while the thin transparent light-green lines show the evolutionary tracks of all stars from an age of 104 yr to the time of the snapshot, and the thin transparent light-blue lines are the evolutionary tracks with episodic accretion included. Stellar evolution is computed following the methodology of Jensen & Haugbølle (2018).
Current usage metrics show cumulative count of Article Views (full-text article views including HTML views, PDF and ePub downloads, according to the available data) and Abstracts Views on Vision4Press platform.
Data correspond to usage on the plateform after 2015. The current usage metrics is available 48-96 hours after online publication and is updated daily on week days.
Initial download of the metrics may take a while.