Fig. 12.
Download original image
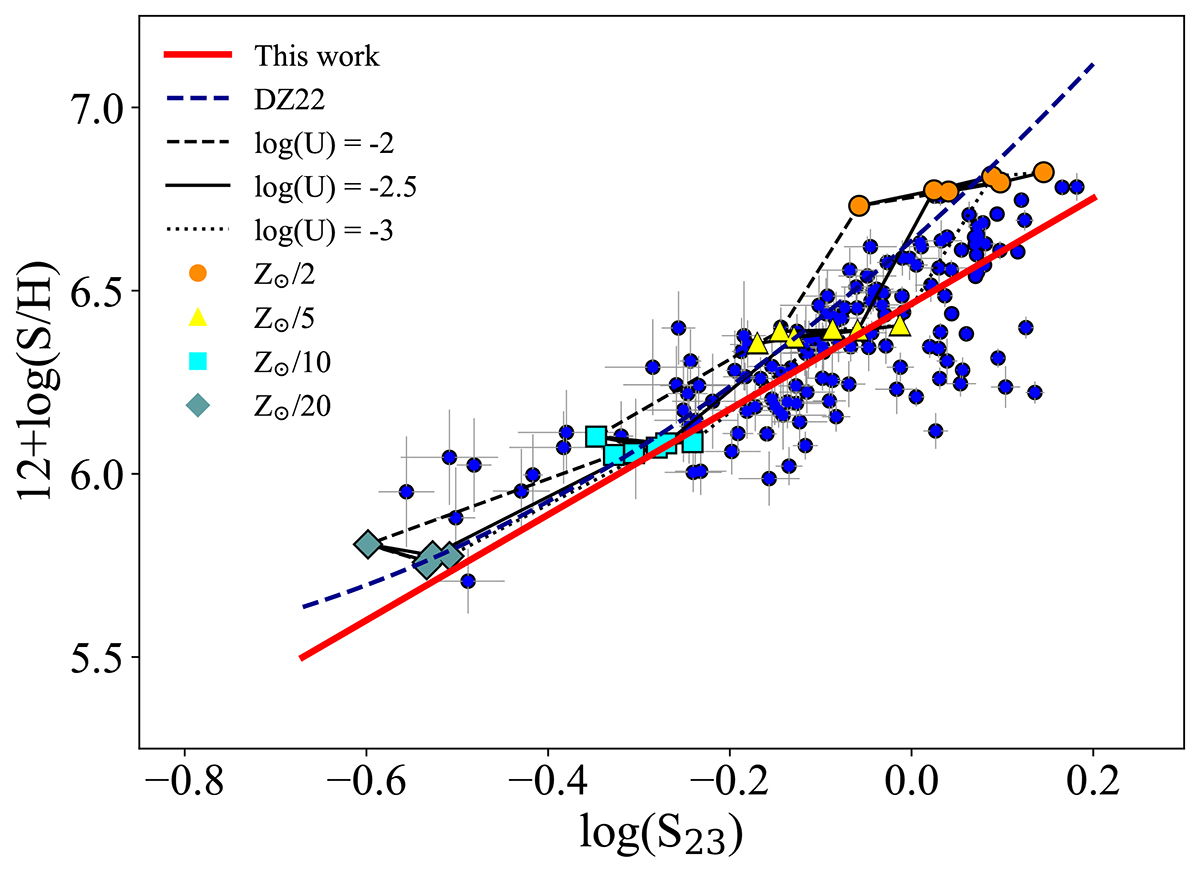
Relation of the total sulphur abundance and the S23 parameter. The blue circles correspond to sample 3 data, the large filled symbols are those from Cloudy models, and the black lines join models with the same ionization parameter. The dashed blue line shows the relation by DZ22, and the solid red line shows the quadratic fit of the data.
Current usage metrics show cumulative count of Article Views (full-text article views including HTML views, PDF and ePub downloads, according to the available data) and Abstracts Views on Vision4Press platform.
Data correspond to usage on the plateform after 2015. The current usage metrics is available 48-96 hours after online publication and is updated daily on week days.
Initial download of the metrics may take a while.