Open Access
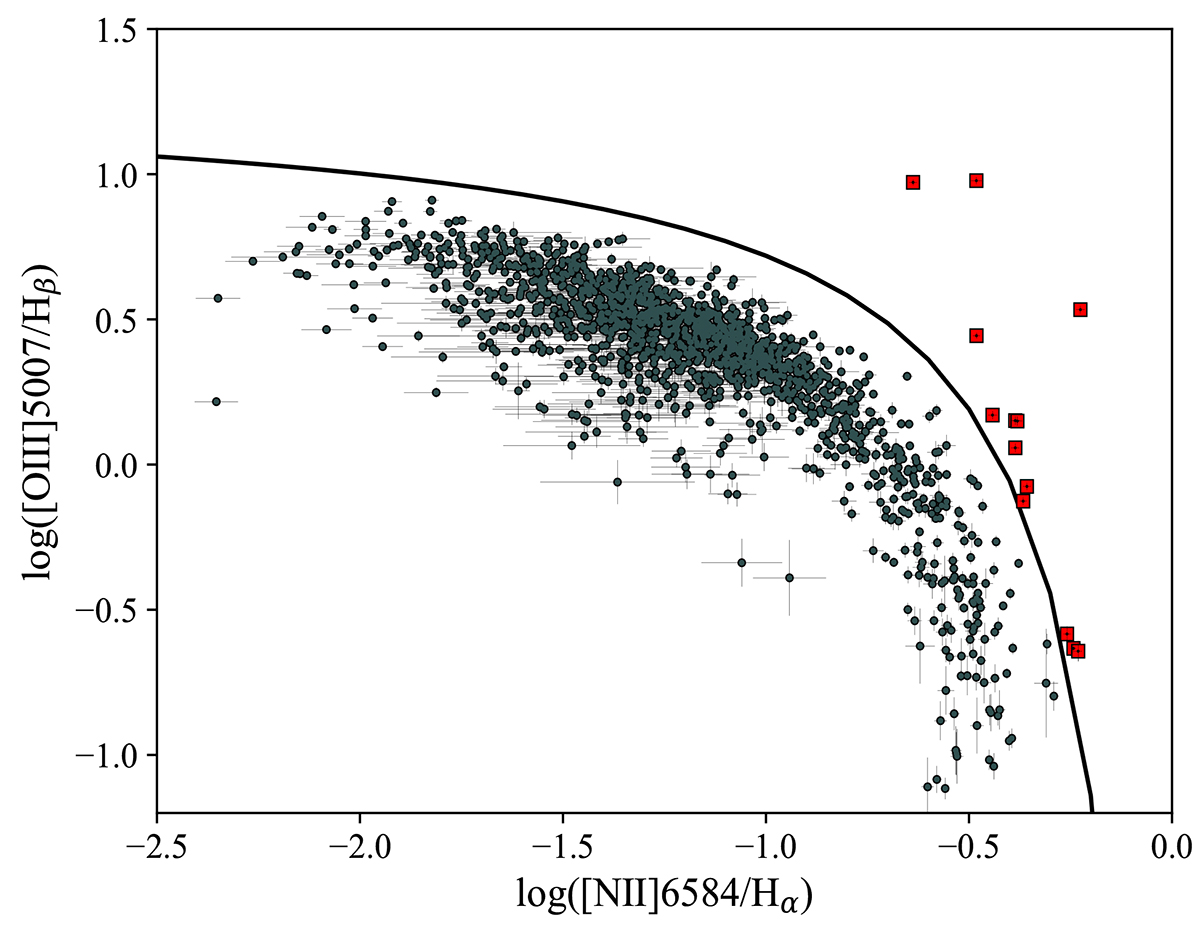
Fig. 1.
Download original image
Classical BPT diagram. The solid black line was described in Kewley et al. (2006). The fluxes and errors are those provided by the SDSS database. The objects marked with red squares were removed from our analysis.
Current usage metrics show cumulative count of Article Views (full-text article views including HTML views, PDF and ePub downloads, according to the available data) and Abstracts Views on Vision4Press platform.
Data correspond to usage on the plateform after 2015. The current usage metrics is available 48-96 hours after online publication and is updated daily on week days.
Initial download of the metrics may take a while.