| Issue |
A&A
Volume 694, February 2025
|
|
|---|---|---|
| Article Number | A95 | |
| Number of page(s) | 5 | |
| Section | Cosmology (including clusters of galaxies) | |
| DOI | https://doi.org/10.1051/0004-6361/202450664 | |
| Published online | 05 February 2025 | |
Gravitational wave memory imprints on the CMB from populations of massive black hole mergers
1
Niels Bohr International Academy, Niels Bohr Institute, Blegdamsvej 17, DK-2100 Copenhagen Ø, Denmark
2
Departament d’Astronomia i Astrofísica, Universitat de Valéncia, Dr Moliner 50, 46100 Burjassot (Valéncia), Spain
⋆ Corresponding author; This email address is being protected from spambots. You need JavaScript enabled to view it.
Received:
9
May
2024
Accepted:
26
October
2024
Abstract
Aims. Our aim is to showcase and characterise the rich phenomenology of temperature fluctuation patterns that are imprinted on the cosmic microwave background (CMB) by the gravitational wave memory (GWM) of massive black hole mergers.
Methods. We analysed both individual binaries as well as populations of binaries, distributed in local cosmological boxes at a given redshift.
Results. The magnitude of the temperature fluctuations scales primarily as a function of binary total mass and pattern angular scale, and accumulates as a random-walk process when populations of mergers are considered. Fluctuations of order ∼10−12 K are reached across scales of ∼1′ to ∼1° for realistic volumetric merger rates of 10−3 Mpc−3 Gyr−1, as is appropriate for massive galaxies at z = 1. We determined numerically that GWM temperature fluctuations result in a universal power spectrum with a scaling of P(k)∝k−2.7.
Conclusions. While not detectable given the limitations of current all-sky CMB surveys, our work explicitly shows how every black hole merger in the Universe left us its unique faint signature.
Key words: black hole physics / gravitational waves / cosmic background radiation
© The Authors 2025
 Open Access article, published by EDP Sciences, under the terms of the Creative Commons Attribution License (https://creativecommons.org/licenses/by/4.0), which permits unrestricted use, distribution, and reproduction in any medium, provided the original work is properly cited.
This article is published in open access under the Subscribe to Open model. This email address is being protected from spambots. You need JavaScript enabled to view it. to support open access publication.
1. Introduction
Gravitational wave memory (GWM) is a phenomenon in general relativity, in which the passing of a gravitational wave (GW) leaves a permanent, transverse displacement in a ring of test masses (Zel’dovich & Polnarev 1974; Christodoulou 1991; Thorne 1992; Blanchet & Damour 1992; Talbot et al. 2018). The observational consequences of GWM are plentiful, ranging from improved parameter estimation for individual compact object mergers (Braginsky & Thorne 1987; Favata 2009, 2010; Lasky et al. 2016; Tiwari et al. 2021), to the existence of astrophysical GWM backgrounds in various frequency bands (Zhao & Cao 2022), manifestations in cosmology (Tolish & Wald 2016; Bieri et al. 2017; Jokela et al. 2022), and finally its influence on the radiation from the cosmic microwave background (CMB).
The latter is perhaps the most intriguing, as CMB observations constitute the cornerstone of our current understanding of the early Universe (Planck Collaboration VI 2020). Gravitational wave memory results in both the red-shifting of CMB radiation as well as the mixing of power from different modes. Both of these aspects have been beautifully studied in Madison (2020) and Madison (2021) for the first time. However, the aforementioned works do not attempt to make an explicit connection with astrophysical populations of sources, opting instead to treat the problem with more generality. Very recently, the former point has been addressed in Boybeyi et al. (2024), showing how realistic populations of mergers produce an accumulation of GWM that affects the astrometry of far-away point sources. However, this study focusses solely on the deflection to CMB photon paths as an observable consequence of GWM.
In this work, we focus instead on the temperature fluctuations directly imprinted on the CMB by the GWM of massive black hole (MBH) mergers. We find that the accumulation of GWM caused by multiple mergers grows such fluctuations in a random-walk-like fashion (see also Boybeyi et al. 2024), leading to a rich and potentially extremely informative phenomenology of patterns that lives hidden orders of magnitude below the observational limitations of current all-sky CMB surveys.
2. GWM from binary mergers sourcing CMB temperature fluctuations
Gravitational waves propagate from their source radially as transverse-traceless waves. Here, we assume the source to be a compact object binary with total mass, M, and inclination, ι. We expect GWM to be present once information about the binary merger reaches a given space-time location, at a luminosity distance, D. The strain tensor for the non-linear GWM of a black hole (BH) binary at merger is given by Favata (2009):
where G is Newton’s gravitational constant, c is the speed of light, and the GW had been propagating in the x direction. We note that here we have assumed equal mass binary components, and we shall do so for the remainder of this work. Photons travelling through space may experience permanent distortions and deflections caused by the GWM from one such merger event. Here, we focus solely on the resulting change in the photon wavelength. While GWM also causes path deflections (Madison 2020, see also Kopeikin et al. (1999), Book & Flanagan (2011) for the analogous effect from general GWs), the latter will be dominated by gravitational lensing from the entire dark matter halo, by a factor of ∼MHalo/M. We leave the convolution of these two effects for future work.
We devised a strategy to calculate the imprint of GWM on 2D patches of the CMB1. We modelled MBH mergers as events, distributed in a local box placed at a particular redshift. Each event, E, was characterised by the following labels:
![Mathematical equation: $$ \begin{aligned} E:= \left[t_{\rm m},x,y,z,M,\iota ,\gamma \right], \end{aligned} $$](/articles/aa/full_html/2025/02/aa50664-24/aa50664-24-eq2.gif) (1)
(1)
where tm is the local time of the merger and x, y, and z are its spatial co-ordinates, while γ is an additional orientation angle of the MBH binary with respect to the observer reference frame. Each event was given a total mass, M, and was sampled from a uniform distribution in time, inclination, and orientation. The spatial co-ordinates of the events were instead sampled from a 3D distribution with a given power spectrum of the form:
 (2)
(2)
with k being the Fourier mode. Large values of n describe highly spatially clustered events. For the majority of our analysis, we drew events from an uniform distribution; in other words, in the following, we set n = 0 unless otherwise stated. We note that here we have not considered any possible clustering in time.
For our purposes, it suffices to assume that GWM acts as a step function that propagates information about the merger event outwards in a shell. We modelled it with a Heaviside function, ΘH:
 (3)
(3)
where xm is the location of the merger. The CMB photons that intersect the shell are therefore instantaneously affected by GWM. Their wavelength is either stretched or squeezed by the transverse-traceless metric strain projected along the photon propagation vector. The resulting change in wavelength is therefore maximised when photons intersect the expanding GWM shell at right angles. Across CMB patches, this effect manifests as a correlated wavelength perturbation pattern.
Hereafter, we use Wien’s displacement law to relate a small change in photon wavelength to a corresponding change in bulk blackbody temperature:
 (4)
(4)
where λph is the photon’s wavelength at peak spectral radiance and T is the mean CMB temperature. To produce 2D temperature fluctuation maps, we can apply the GWM of single or multiple events to a surface of photons, being careful to project each GWM strain correctly.
3. Temperature fluctuations from individual major mergers
In Fig. 1, we showcase the full GMW imprint of an individual merger event on the CMB temperature, where we vary both inclination and orientation angles. We find that the shape of the patterns is determined by the angles ι and γ, while the amplitude and scale are determined by the mass, M, the merger time, tm, the location of the merger along the line of sight, and the inclination (to a lesser degree). As was expected, the average temperature across the 2D image is unaffected. The patterns roughly scale with the size of the GWM shell (dashed grey line) at the time the photon surface matches with the location of the source.
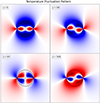 |
Fig. 1. Temperature fluctuation patterns for photons that have exited a local box, caused by an individual merger event with different orientation angles, γ = 0. The amplitude and physical scale of the fluctuations can be found by using Eq. (5). Note that the average temperature fluctuation always vanishes, by merit of the tracelessness of the GWM tensor. The projected scale of the patterns is related to the size of the GWM shell at the time the surface of photons crosses the co-ordinates of the source, denoted by the dashed grey line. |
We find the following scaling for the maximum amplitude of temperature fluctuations caused by an individual event:
 (5)
(5)
where R > 0 is the radius of the GWM shell and T(zm) denotes the mean CMB temperature at the redshift of the merger event. Here, we have scaled our results with values typical for SMBH binaries, as they are the loudest astrophysical source of GWs, and therefore GWM. The maximum temperature perturbation scales inversely with R, meaning that photons that intersect the GWM shell close to the merger experience the largest temperature perturbations.
In order to turn a physical scale into an angular scale, we need to specify a redshift. Here, we scale our results with a redshift of z = 1, which roughly corresponds to the peak of the massive galaxy volumetric merger rate (Fakhouri et al. 2010; O’Leary et al. 2021; Conselice et al. 2022). We find the following scaling:
 (6)
(6)
where β is the angular scale of the GWM shell, and we now neglect the inclination dependence. Here, 𝒟θ is the angular diameter distance of a given cosmology, which peaks at roughly z ∼ 1 in Λ-CDM (Peebles 1993). For our purposes, redshifts of ∼1 are therefore the most unfavourable, as by this effect alone temperature fluctuations at a given angular scale will have amplitudes a factor of ∼2 higher if produced at z = 7 rather than z = 1. It should be noted that here we chose to scale the results with one minute of arc (1′), as the typical resolution of state-of-the-art all-sky CMB missions is ∼5′ (The COrE Collaboration 2011; Planck Collaboration III 2020).
In reality, the temperature patterns produced by the GWM of mergers are not static. Different isochrone surfaces of CMB photons continuously traverse any local box that contains MBH mergers, causing the projected patterns of temperature fluctuations to vary in time, roughly in proportion to their physical scale (as ∼R/c). We showcase several movies of time-evolving fluctuations, the footage of which can be found here2. For a single event, the GWM shell propagates radially with the passing of time, affecting photons at greater distances from the source. The result is to enlarge the physical scale of the pattern as well as decrease its amplitude. We can express the typical temperature fluctuation, as it is seen by a local observer, as a function of the elapsed time, τ, after the merger has occurred:
 (7)
(7)
4. Temperature fluctuations from populations of mergers
Fig. 2 shows three realisations of the temperature fluctuation patterns in a local box of size ∼(100 Mpc)3, populated with 10, 100, and 1000 sources, respectively. Here, the events all have the same mass of 109 M⊙, but are otherwise drawn from uniform distributions. While the resulting temperature fluctuations seem to increase in complexity and resolution, they are composed of superpositions (ignoring non-linearities of the order hij2) of the individual patterns showcased in Fig. 1, appearing at different scales and with different orientations and inclinations.
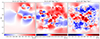 |
Fig. 2. Three realisations of the CMB temperature fluctuations caused by the GWM of a population of mergers. The merger events have a mass of M = 109 M⊙ and are drawn from a uniform distribution in space-time and inclination and orientation angles. As the number of mergers is increased according to a specified volumetric merger rate, ℛ, both the amplitude and the standard deviation of the temperature fluctuations grows following a random-walk scaling. The colour bars are adjusted to account for this behaviour. With sufficient sources within a box (∼10 or more), the temperature fluctuations tend to follow universal power spectrum with a scaling, ∝k−2.7, where k are the modes. |
As the mean of the fluctuations is always vanishing, we expect both the maximum and the standard deviation of temperature fluctuations within a given box to roughly follow a random-walk process (see also Boybeyi et al. 2024). Both of the aforementioned quantities should scale as  , where N is the total amount of merger events in the box. Here, we have explicitly confirmed the hypothesis by setting up local boxes of various sizes. We populated the boxes with events corresponding to a given volumetric merger rate, ℛ. A specific realisation of one such test is visualised in Fig. 3, showing both the maximum and standard deviations of the temperature fluctuations averaged over a total of ∼3 × 10⁴ realisations with a varying number of events. These particular realisations were performed in a box 100 Mpc in length, roughly corresponding to a few degrees of angular scale at z = 1. The masses were set to 109 M⊙ and the remaining parameters were drawn from uniform distributions. Throughout our tests, we find that both the maximum and the standard deviation of temperature fluctuations in a given CMB patch scale with the square root of the average local volumetric merger rate in the corresponding box. The maximum follows:
 (8)
(8)
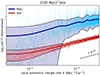 |
Fig. 3. Maximum and standard deviation of temperature fluctuations for CMB photons that passed through a (100 Mpc)3 cosmological box. The box is populated with 109 M⊙ mergers according to a given volumetric merger rate, which are otherwise sampled uniformly in space, time, inclination, and orientation. The results are averaged over a total of ∼3 × 10⁴ realisations (pale lines), an both the mean (solid lines) and the standard deviation (shaded areas enclosed by black lines) of the realisations are shown. |
though always presents a significant scatter, varying by a factor of approximately 2–5 at 1σ, depending on the total number of events. We note that here T(zbox) denotes the average local CMB temperature, a quantity that is well defined only for sufficiently small boxes. The standard deviation follows
 (9)
(9)
with significantly less scatter. Volumetric merger rates of order 10−4 Mpc−3 Gyr−1 to 10−3 Mpc−3 Gyr−1 are what is typically observed for the major mergers of massive galaxies with stellar mass above 1011 M⊙ at z ∼ 1 (Bell et al. 2006; O’Leary et al. 2021). According to observations, such galaxies typically host BHs in the range from 107 M⊙ to several 109 M⊙ depending on galaxy morphology (Reines & Volonteri 2015; Zhu et al. 2021), with an occupation fraction that approaches unity for more massive galaxies (Volonteri et al. 2016). We scaled Eqs. (8) and (9) with the volumetric merger rates and BH masses appropriate to such galaxies, assuming that the BH merger rate would be roughly of the same order. As was discussed before, the temperature fluctuations vary in time. We showcase an animation for the case of 20 randomly distributed sources here3. We observe the superposition of patterns from individual sources, each of which expands and fades during its evolution according to timescales of order Ri/c, where Ri are the scales of each individual pattern.
We find that the GWM effect of a population of mergers gives rise to a characteristic power spectrum in the resulting CMB temperature fluctuation. Fig. 4 shows the power spectrum from 100 merger population realisations of boxes of a local size (30 Mpc) containing 10, 100, and 1000 mergers. Due to the  proportionality of the maximum temperature fluctuation described above, the amplitude of the power spectrum similarly increases with the density of mergers. The larger scatter present for lower merger density is caused by small-number statistics, where with too few sources the initial merger distribution can be very inhomogenous when drawn randomly. We fitted a power law, P(k)∝kn, to the curves displayed in Fig. 4, disregarding the lowest (k < 3) and highest modes (k > 40) to avoid boundary and resolution effects of the temperature map. Here, k is in units of the image resolution, and can be easily transformed to physical scales given the scale of the CMB patch. We find the best fit scaling to be n = −3.07 ± 0.62, n = −2.82 ± 0.30, and n = −2.71 ± 0.11 for patterns caused by 10, 100, and 1000 sources, respectively. We find that the scaling of the power spectrum of temperature fluctuations converges to a universal value of
 (10)
(10)
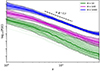 |
Fig. 4. Realisations of the power spectrum of CMB temperature fluctuations caused by the GWM of 10, 100, and 1000 mergers within a local (30 Mpc)3 box (pale lines). We find that the power spectra follow a universal scaling, ∝k−2.7, where k are the modes of the image (here in units of image resolution). The mean (thick lines) and the 2σ contours (shaded areas) are also displayed. |
within all CMB patches that contain a sufficient number of merger events.
5. Towards detecting GWM imprints
The temperature fluctuations patterns analysed in this work showcase how every single BH merger leaves its signature on CMB radiation. Though hidden below a myriad of other signals (see e.g. Planck Collaboration I 2020; Raghunathan 2022; Bianchini & Millea 2023), the entire merger history of BHs is marked on the oldest image of our Universe. Nevertheless, while contemplating such aesthetically pleasing thoughts, the astrophysicist is called to ask whether such patterns are actually detectable. Here, we offer a few insights, with the understanding that detecting such fluctuations may well be exceedingly challenging. Though real, they are small in amplitude and have to be de-convolved from lensing, path deflections, and other sources of noise. We welcome input from the broader community to explore some non-trivial detection techniques (see e.g. Kusiak et al. 2023, for an attempt to reduce contamination from astrophysical noise sources).
HOLMBERG 15 is a nearby ultra-massive BH with a mass of ∼4 × 10¹⁰ M⊙, located at a redshift of z ∼ 0.05 (Mehrgan et al. 2019). We explored whether it is possible to exclude that it experienced a major merger in its recent past. Supposing a CMB microwave interferometer sensitive to wavelengths λsens of ∼2 mm and temperature fluctuations of ΔTsens (see Dickinson et al. 2004, as an example), the latter would require the following baseline, B, in order to resolve the GWM pattern around a presumed major merger with total mass, M, at z = 0.05:
 (11)
(11)
where we used Eq. (6) and TCMB = 2.73 K. While beyond the size of many current telescope arrays, such baselines are technologically feasable. However, at the corresponding resolution of tens of milli-arcseconds the GWM pattern would appear at scales of hundreds of parsecs, only approximately 102 years after the merger. Improving the temperature fluctuation sensitivity beyond the typical values of current all-sky CMB surveys would allow one to measure the patterns at larger scales, and probe whether a merger occurred further back in time. It is worth noting here that the GWM fluctuations will most likely be self-lensed, increasing their amplitude.
Our estimates for the random-walk-like accumulation of GWM apply to single mass populations of sources in local boxes. A complete assessment requires modelling the merger rates of all MBHs across cosmic time (see Boybeyi et al. 2024, for a possible approach). At higher redshifts in particular, however, the mass spectra and merger rates of MBHs are purely speculative. The latter may well be much higher than what is adopted in this paper (see some estimates on the merger rate of primordial BHs for an extreme example Ali-Haïmoud et al. 2017; Huang et al. 2024). We have shown that the power spectrum of temperature fluctuations is universal as soon as sufficient mergers are present in a given patch of CMB. For a volumetric merger rate of 10−3 Mpc−3 Gyr−1, this is realised for a box with an angular scale of approximately 1°, of which there are 41 253 independent realisations on the full sky. Knowing the scaling a priori, the question is whether it is possible to coherently add up power from all such patches in a way that suppresses other contributions. Additionally, among the 41 253 realisations, there are between two and three patches that are 4 sigma statistical outliers. Here, outlier could refer to several of the quantities relevant to the accumulation of GWM, such as the merger rate or typical MBH masses, or simply to the realisation statistics of the random walk. There is always some probability that in some region of the sky the effects we discussed may be unusually large, though quantifying this would require a fully cosmological treatment over the entire sky. In the same vein, we note that our analysis should be convolved with an evolving cosmological metric, which will most likely increase the magnitude of the effect by an appreciable amount.
6. Data availability
All animations are stored and available on Zenodo, under the following repository.
See https://www.youtube.com/watch?v=s2d9ROsMoF0 for a visualisation of our setup, or our Zenodo repository.
Acknowledgments
L.Z. and K.H. acknowledge support from ERC Starting Grant No. 121817–BlackHoleMergs. M.M.T. acknowledges support from the Ministerio de Ciencia, Innovación y Universidades del Gobierno de España through the “Ayuda para la Formación de Profesorado Universitario” (FPU) No. FPU19/01750 and the “Ayuda FPU Complementaria de Movilidad para Estancias Breves en Centros Extranjeros” No. EST23/00420, and from the Spanish Agencia Estatal de Investigación (grant PID2021-125485NB-C21) funded by MCIN/AEI/10.13039/501100011033 and ERDF A way of making Europe. D.ON gratefully acknowledges support from Villum Fonden Grant No. 29466 and the Danish Independent Research Fund through Sapere Aude Starting Grant No. 121587. P.K. acknowledges support from the Stefan Rozental og Hanna Kobylinski Rozentals Fond. The authors acknowledge Daniel J. D’Orazio, Johan Samsing and Martin Pessah for helpful discussions. The authors are grateful for the existence and convenient location of Søernes Ø lbar.
References
- Ali-Haïmoud, Y., Kovetz, E. D., & Kamionkowski, M. 2017, Phys. Rev. D, 96, 123523 [CrossRef] [Google Scholar]
- Bell, E. F., Phleps, S., Somerville, R. S., et al. 2006, ApJ, 652, 270 [NASA ADS] [CrossRef] [Google Scholar]
- Bianchini, F., & Millea, M. 2023, Phys. Rev. D, 107, 043521 [NASA ADS] [CrossRef] [Google Scholar]
- Bieri, L., Garfinkle, D., & Yunes, N. 2017, CQG, 34, 215002 [NASA ADS] [CrossRef] [Google Scholar]
- Blanchet, L., & Damour, T. 1992, Phys. Rev. D, 46, 4304 [NASA ADS] [CrossRef] [Google Scholar]
- Book, L. G., & Flanagan, E. E. 2011, Phys. Rev. D, 83, 024024 [NASA ADS] [CrossRef] [Google Scholar]
- Boybeyi, T., Mandic, V., & Papageorgiou, A. 2024, arXiv e-prints [arXiv:2403.07614] [Google Scholar]
- Braginsky, V. B., & Thorne, K. S. 1987, Nature, 327, 123 [CrossRef] [Google Scholar]
- Christodoulou, D. 1991, Phys. Rev. Lett., 67, 1486 [NASA ADS] [CrossRef] [Google Scholar]
- Conselice, C. J., Mundy, C. J., Ferreira, L., & Duncan, K. 2022, ApJ, 940, 168 [CrossRef] [Google Scholar]
- Dickinson, C., Battye, R. A., Carreira, P., et al. 2004, MNRAS, 353, 732 [CrossRef] [Google Scholar]
- Fakhouri, O., Ma, C.-P., & Boylan-Kolchin, M. 2010, MNRAS, 406, 2267 [Google Scholar]
- Favata, M. 2009, ApJ, 696, L159 [NASA ADS] [CrossRef] [Google Scholar]
- Favata, M. 2010, CQG, 27, 084036 [NASA ADS] [CrossRef] [Google Scholar]
- Huang, H.-L., Jiang, J.-Q., & Piao, Y.-S. 2024, Phys. Rev. D, 109, 063515 [NASA ADS] [CrossRef] [Google Scholar]
- Jokela, N., Kajantie, K., & Sarkkinen, M. 2022, Phys. Rev. D, 106, 064022 [NASA ADS] [CrossRef] [Google Scholar]
- Kopeikin, S. M., Schäfer, G., Gwinn, C. R., & Eubanks, T. M. 1999, Phys. Rev. D, 59, 084023 [NASA ADS] [CrossRef] [Google Scholar]
- Kusiak, A., Surrao, K. M., & Hill, J. C. 2023, Phys. Rev. D, 108, 123501 [NASA ADS] [CrossRef] [Google Scholar]
- Lasky, P. D., Thrane, E., Levin, Y., Blackman, J., & Chen, Y. 2016, Phys. Rev. Lett., 117, 061102 [NASA ADS] [CrossRef] [Google Scholar]
- Madison, D. R. 2020, Phys. Rev. Lett., 125, 041101 [NASA ADS] [CrossRef] [Google Scholar]
- Madison, D. R. 2021, Phys. Rev. D, 103, 083515 [NASA ADS] [CrossRef] [Google Scholar]
- Mehrgan, K., Thomas, J., Saglia, R., et al. 2019, ApJ, 887, 195 [NASA ADS] [CrossRef] [Google Scholar]
- O’Leary, J. A., Moster, B. P., Naab, T., & Somerville, R. S. 2021, MNRAS, 501, 3215 [Google Scholar]
- Peebles, P. J. E. 1993, Principles of Physical Cosmology (Princeton: Princeton University Press) [Google Scholar]
- Planck Collaboration I. 2020, A&A, 641, A1 [NASA ADS] [CrossRef] [EDP Sciences] [Google Scholar]
- Planck Collaboration III. 2020, A&A, 641, A3 [NASA ADS] [CrossRef] [EDP Sciences] [Google Scholar]
- Planck Collaboration VI. 2020, A&A, 641, A6 [NASA ADS] [CrossRef] [EDP Sciences] [Google Scholar]
- Raghunathan, S. 2022, ApJ, 928, 16 [NASA ADS] [CrossRef] [Google Scholar]
- Reines, A. E., & Volonteri, M. 2015, ApJ, 813, 82 [NASA ADS] [CrossRef] [Google Scholar]
- Talbot, C., Thrane, E., Lasky, P. D., & Lin, F. 2018, Phys. Rev. D, 98, 064031 [NASA ADS] [CrossRef] [Google Scholar]
- The COrE Collaboration (Armitage-Caplan, C., et al.) 2011, arXiv e-prints [arXiv:1102.2181] [Google Scholar]
- Thorne, K. S. 1992, Phys. Rev. D, 45, 520 [NASA ADS] [CrossRef] [Google Scholar]
- Tiwari, S., Ebersold, M., & Hamilton, E. Z. 2021, Phys. Rev. D, 104, 123024 [NASA ADS] [CrossRef] [Google Scholar]
- Tolish, A., & Wald, R. M. 2016, Phys. Rev. D, 94, 044009 [NASA ADS] [CrossRef] [Google Scholar]
- Volonteri, M., Dubois, Y., Pichon, C., & Devriendt, J. 2016, MNRAS, 460, 2979 [Google Scholar]
- Zel’dovich, Y. B., & Polnarev, A. G. 1974, Sov. Astron., 18, 17 [Google Scholar]
- Zhao, Z.-C., & Cao, Z. 2022, Sci. China Phys. Mech. Astron., 65, 119511 [NASA ADS] [CrossRef] [Google Scholar]
- Zhu, P., Ho, L. C., & Gao, H. 2021, ApJ, 907, 6 [NASA ADS] [CrossRef] [Google Scholar]
All Figures
|
Fig. 1. Temperature fluctuation patterns for photons that have exited a local box, caused by an individual merger event with different orientation angles, γ = 0. The amplitude and physical scale of the fluctuations can be found by using Eq. (5). Note that the average temperature fluctuation always vanishes, by merit of the tracelessness of the GWM tensor. The projected scale of the patterns is related to the size of the GWM shell at the time the surface of photons crosses the co-ordinates of the source, denoted by the dashed grey line. |
| In the text | |
|
Fig. 2. Three realisations of the CMB temperature fluctuations caused by the GWM of a population of mergers. The merger events have a mass of M = 109 M⊙ and are drawn from a uniform distribution in space-time and inclination and orientation angles. As the number of mergers is increased according to a specified volumetric merger rate, ℛ, both the amplitude and the standard deviation of the temperature fluctuations grows following a random-walk scaling. The colour bars are adjusted to account for this behaviour. With sufficient sources within a box (∼10 or more), the temperature fluctuations tend to follow universal power spectrum with a scaling, ∝k−2.7, where k are the modes. |
| In the text | |
|
Fig. 3. Maximum and standard deviation of temperature fluctuations for CMB photons that passed through a (100 Mpc)3 cosmological box. The box is populated with 109 M⊙ mergers according to a given volumetric merger rate, which are otherwise sampled uniformly in space, time, inclination, and orientation. The results are averaged over a total of ∼3 × 10⁴ realisations (pale lines), an both the mean (solid lines) and the standard deviation (shaded areas enclosed by black lines) of the realisations are shown. |
| In the text | |
|
Fig. 4. Realisations of the power spectrum of CMB temperature fluctuations caused by the GWM of 10, 100, and 1000 mergers within a local (30 Mpc)3 box (pale lines). We find that the power spectra follow a universal scaling, ∝k−2.7, where k are the modes of the image (here in units of image resolution). The mean (thick lines) and the 2σ contours (shaded areas) are also displayed. |
| In the text | |
Current usage metrics show cumulative count of Article Views (full-text article views including HTML views, PDF and ePub downloads, according to the available data) and Abstracts Views on Vision4Press platform.
Data correspond to usage on the plateform after 2015. The current usage metrics is available 48-96 hours after online publication and is updated daily on week days.
Initial download of the metrics may take a while.