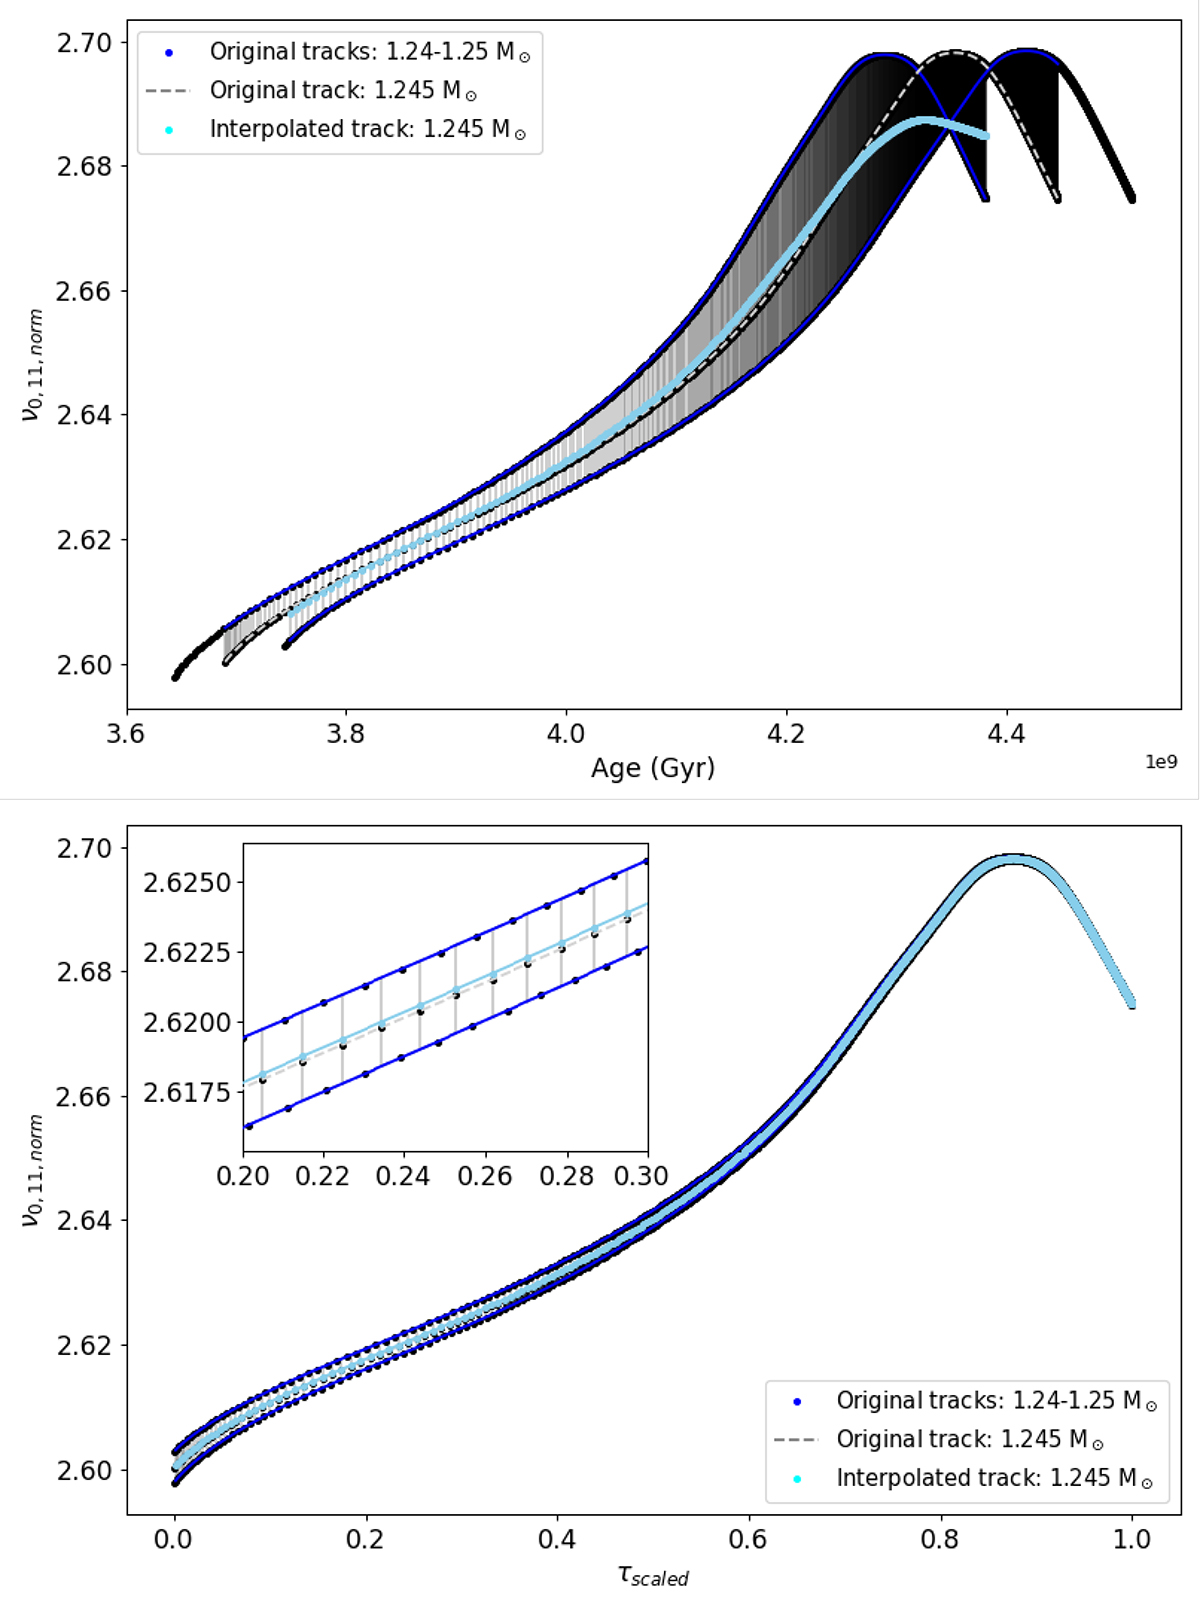
Fig. 8.
Download original image
Evolution of the scaled frequencies for the ℓ = 0 modes, with radial order n = 11, that resulted from applying the interpolation algorithm to the mass track with M = 1.245 M⊙, presented as a function of τ (top) and τscaled (bottom), when each is considered as the respective age proxy for interpolation. The bottom panel displays a subplot that zooms on the region of the age proxy parameter space with the highest interpolation errors.
Current usage metrics show cumulative count of Article Views (full-text article views including HTML views, PDF and ePub downloads, according to the available data) and Abstracts Views on Vision4Press platform.
Data correspond to usage on the plateform after 2015. The current usage metrics is available 48-96 hours after online publication and is updated daily on week days.
Initial download of the metrics may take a while.