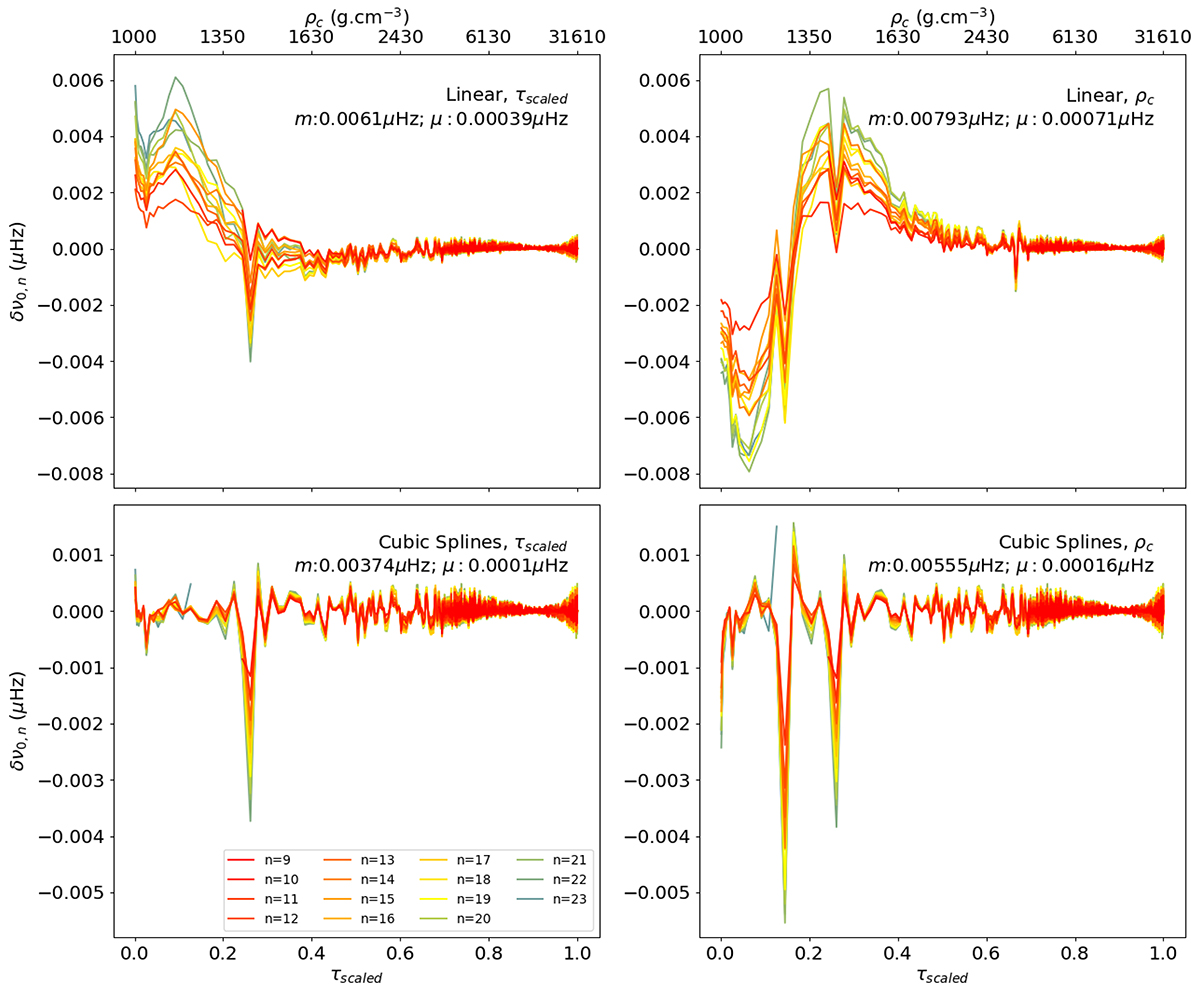
Fig. 3.
Download original image
Interpolation errors presented as a function of τscaled (bottom x-axis) and ρc (top x-axis) that resulted from interpolation along the evolutionary track with M = 1.245 M⊙ for all ℓ = 0 frequency modes, with radial orders n ∈ [9, 23] indicated by different colours. Each subplot presents the results for a different interpolation method, considering different methods – linear (top panels) or cubic splines (bottom panels) – and different age proxies – τscaled (left) and ρc (right).
Current usage metrics show cumulative count of Article Views (full-text article views including HTML views, PDF and ePub downloads, according to the available data) and Abstracts Views on Vision4Press platform.
Data correspond to usage on the plateform after 2015. The current usage metrics is available 48-96 hours after online publication and is updated daily on week days.
Initial download of the metrics may take a while.