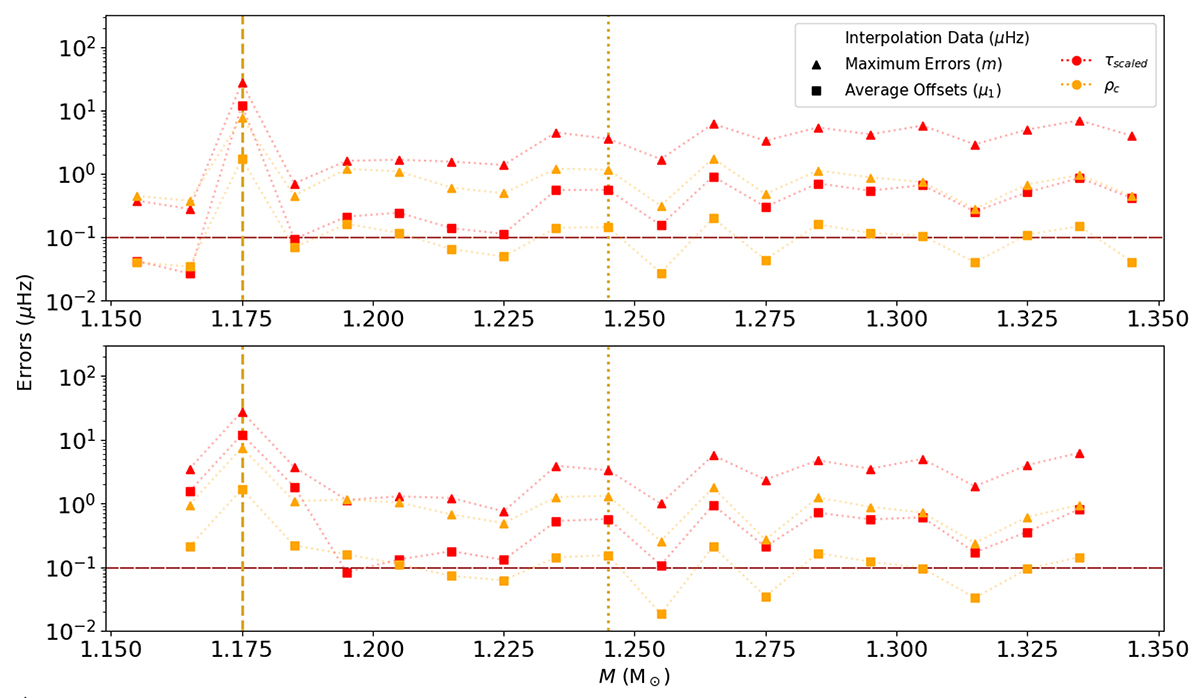
Fig. 10.
Download original image
Average offsets (μ, indicated by squares; in μHz) and maximum errors (m, indicated by triangles; in μHz) from the full interpolation method, which considers cubic splines along evolutionary tracks and linear (top) or cubic splines (bottom) interpolation across evolutionary tracks and τscaled (red) or ρc (yellow) as the age proxy, for all ℓ = 1 modes obtained for the interpolated tracks of the initial grid. The vertical brown dotted line highlights the results for our reference track with M = 1.245 M⊙, while the vertical brown dashed line highlights the anomalous track with M = 1.175 M⊙.
Current usage metrics show cumulative count of Article Views (full-text article views including HTML views, PDF and ePub downloads, according to the available data) and Abstracts Views on Vision4Press platform.
Data correspond to usage on the plateform after 2015. The current usage metrics is available 48-96 hours after online publication and is updated daily on week days.
Initial download of the metrics may take a while.