Fig. 9.
Download original image
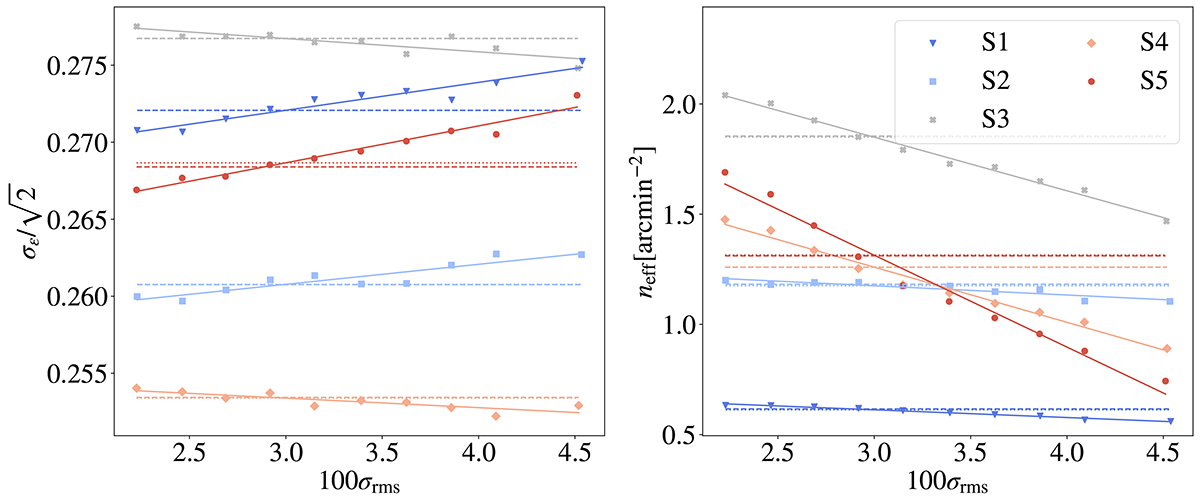
The dependence of the per-component Gaussian shape dispersion, ![]() , (left panel) and the galaxy density, neff, (right panel) on the root-mean square of the background noise, σrms in the KiDS-1000 DR4 data. For both panels, the data points represent the mean σϵ or neff of ten equi-populated bins in σrms with their boundaries in {1.70, 2.33, 2.57, 2.80, 3.04, 3.28, 3.52, 3.76, 4.00, 4.23, 12.96}. The solid line shows the linear fit to the aforementioned data points of their respective tomographic bin according to Eqs. (28) and (29). The parameters obtained from this fit are given in Table 1. The dotted horizontal lines show the mean values of σϵ and neff calculated from the galaxy samples with variable depth per tomographic bin, while the dashed horizontal lines show the values of σϵ and neff for the respective galaxy samples without any spatial variations in the observational depth. Both of these lines agree exceptionally well by construction, so that for some source bins there is not any observable difference between them.
, (left panel) and the galaxy density, neff, (right panel) on the root-mean square of the background noise, σrms in the KiDS-1000 DR4 data. For both panels, the data points represent the mean σϵ or neff of ten equi-populated bins in σrms with their boundaries in {1.70, 2.33, 2.57, 2.80, 3.04, 3.28, 3.52, 3.76, 4.00, 4.23, 12.96}. The solid line shows the linear fit to the aforementioned data points of their respective tomographic bin according to Eqs. (28) and (29). The parameters obtained from this fit are given in Table 1. The dotted horizontal lines show the mean values of σϵ and neff calculated from the galaxy samples with variable depth per tomographic bin, while the dashed horizontal lines show the values of σϵ and neff for the respective galaxy samples without any spatial variations in the observational depth. Both of these lines agree exceptionally well by construction, so that for some source bins there is not any observable difference between them.
Current usage metrics show cumulative count of Article Views (full-text article views including HTML views, PDF and ePub downloads, according to the available data) and Abstracts Views on Vision4Press platform.
Data correspond to usage on the plateform after 2015. The current usage metrics is available 48-96 hours after online publication and is updated daily on week days.
Initial download of the metrics may take a while.