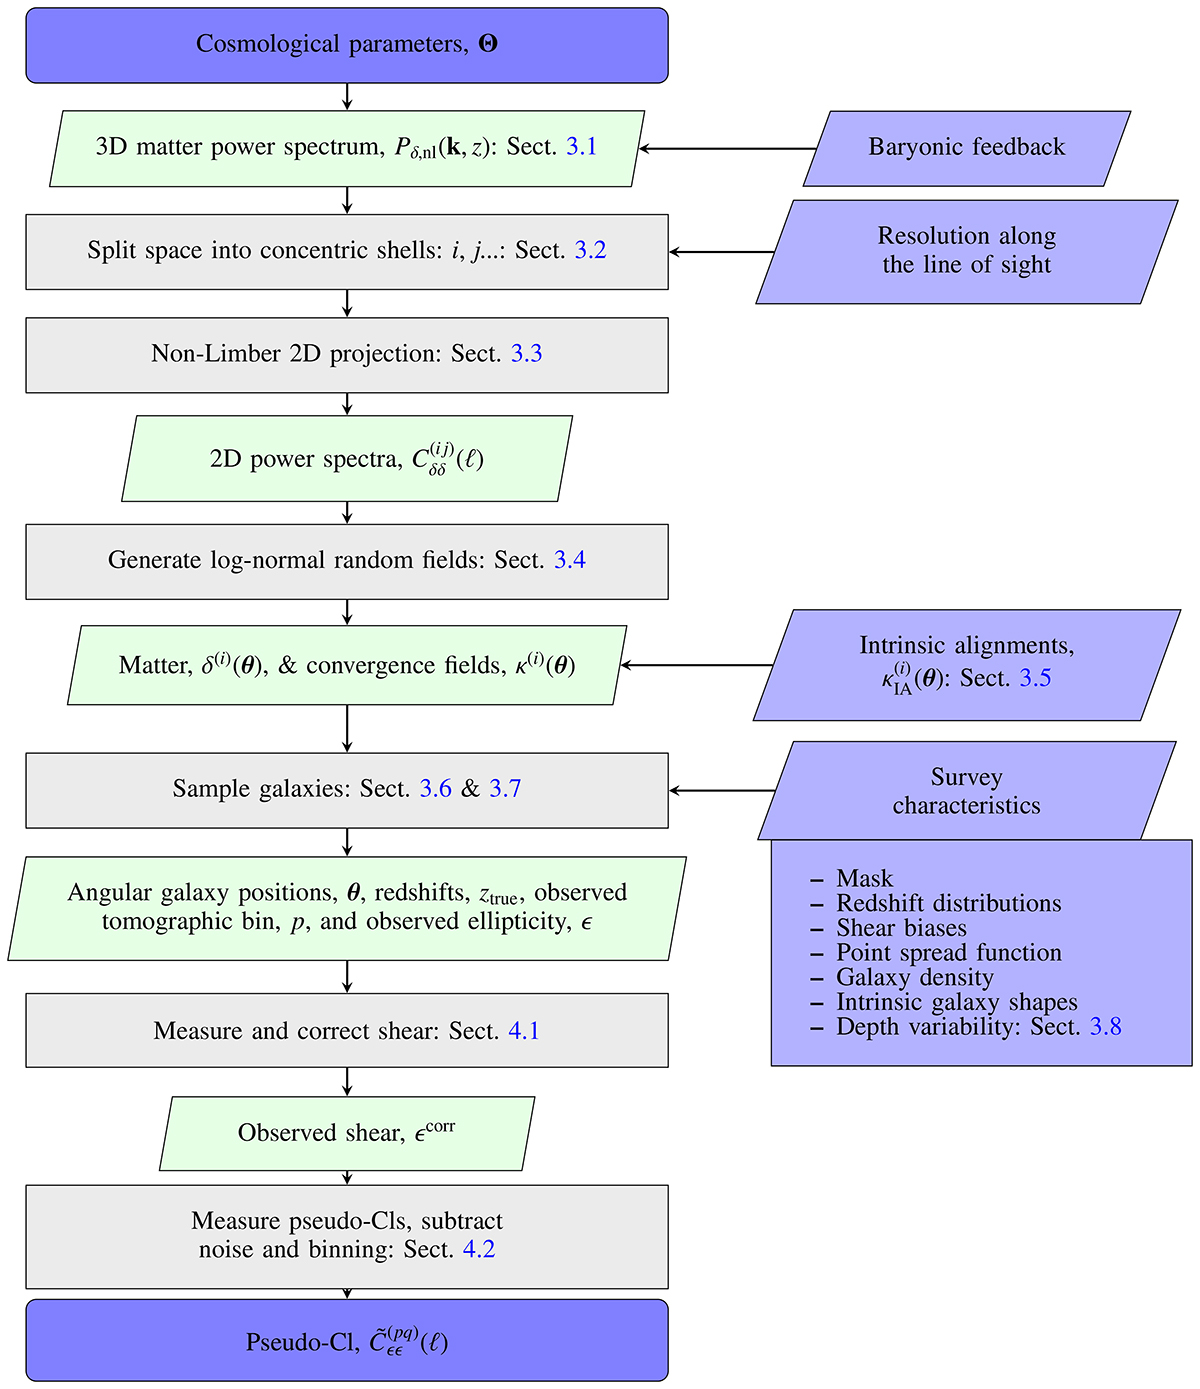
Fig. 3.
Download original image
Flowchart describing the steps in a single forward simulation of cosmic shear observables from cosmological parameters. The dark blue rounded boxes represent the inputs and outputs which are given to the simulation-based inference pipeline. The green slanted boxes represent relevant quantities which are calculated during the simulation. The grey rectangular boxes show steps in the calculations, while the blue slanted boxes show any (systematic) effects which are included. All variables are defined within the respective sections quoted in the diagram.
Current usage metrics show cumulative count of Article Views (full-text article views including HTML views, PDF and ePub downloads, according to the available data) and Abstracts Views on Vision4Press platform.
Data correspond to usage on the plateform after 2015. The current usage metrics is available 48-96 hours after online publication and is updated daily on week days.
Initial download of the metrics may take a while.