Fig. I.1.
Download original image
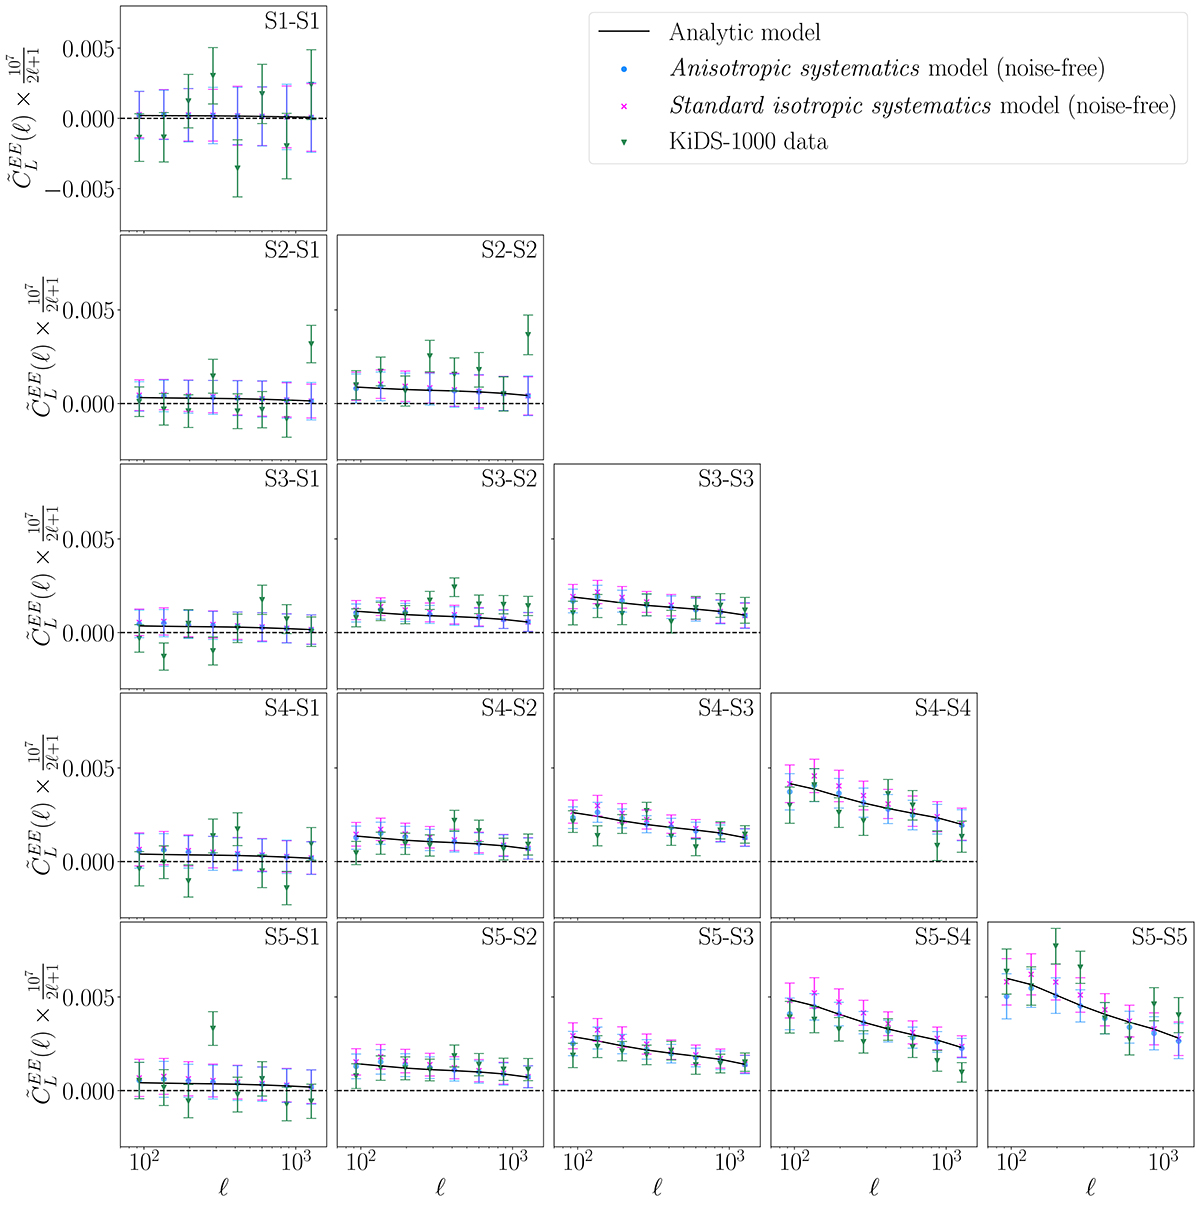
Measured pseudo-Cls, ![]() , for all combinations for five tomographic bins (S1 to S5). The green triangles show the pseudo-Cls from the KiDS-1000 gold sample data. The blue points show the same for a noise-free realisation single realisation of the anisotropic systematics model in KiDS-SBI (see Sect. 5) at the maximum-a-posteriori, MAP (see Table F.1), while the magenta crosses show the measurements for noise-free realisation single realisation of the standard isotropic systematics model in KiDS-SBI (see Sect. 7.2) at the MAP for this model (see Table F.1). The uncertainties on the measurements are derived from the covariance matrix described in Sect. 5.3. The solid black line shows the pseudo-Cls,
, for all combinations for five tomographic bins (S1 to S5). The green triangles show the pseudo-Cls from the KiDS-1000 gold sample data. The blue points show the same for a noise-free realisation single realisation of the anisotropic systematics model in KiDS-SBI (see Sect. 5) at the maximum-a-posteriori, MAP (see Table F.1), while the magenta crosses show the measurements for noise-free realisation single realisation of the standard isotropic systematics model in KiDS-SBI (see Sect. 7.2) at the MAP for this model (see Table F.1). The uncertainties on the measurements are derived from the covariance matrix described in Sect. 5.3. The solid black line shows the pseudo-Cls, ![]() , as derived from theory (see Appendix D for details on this) at the MAP from KiDS-SBI based on the anisotropic systematics model. The horizontal dashed line marks the line of zero signal.
, as derived from theory (see Appendix D for details on this) at the MAP from KiDS-SBI based on the anisotropic systematics model. The horizontal dashed line marks the line of zero signal.
Current usage metrics show cumulative count of Article Views (full-text article views including HTML views, PDF and ePub downloads, according to the available data) and Abstracts Views on Vision4Press platform.
Data correspond to usage on the plateform after 2015. The current usage metrics is available 48-96 hours after online publication and is updated daily on week days.
Initial download of the metrics may take a while.