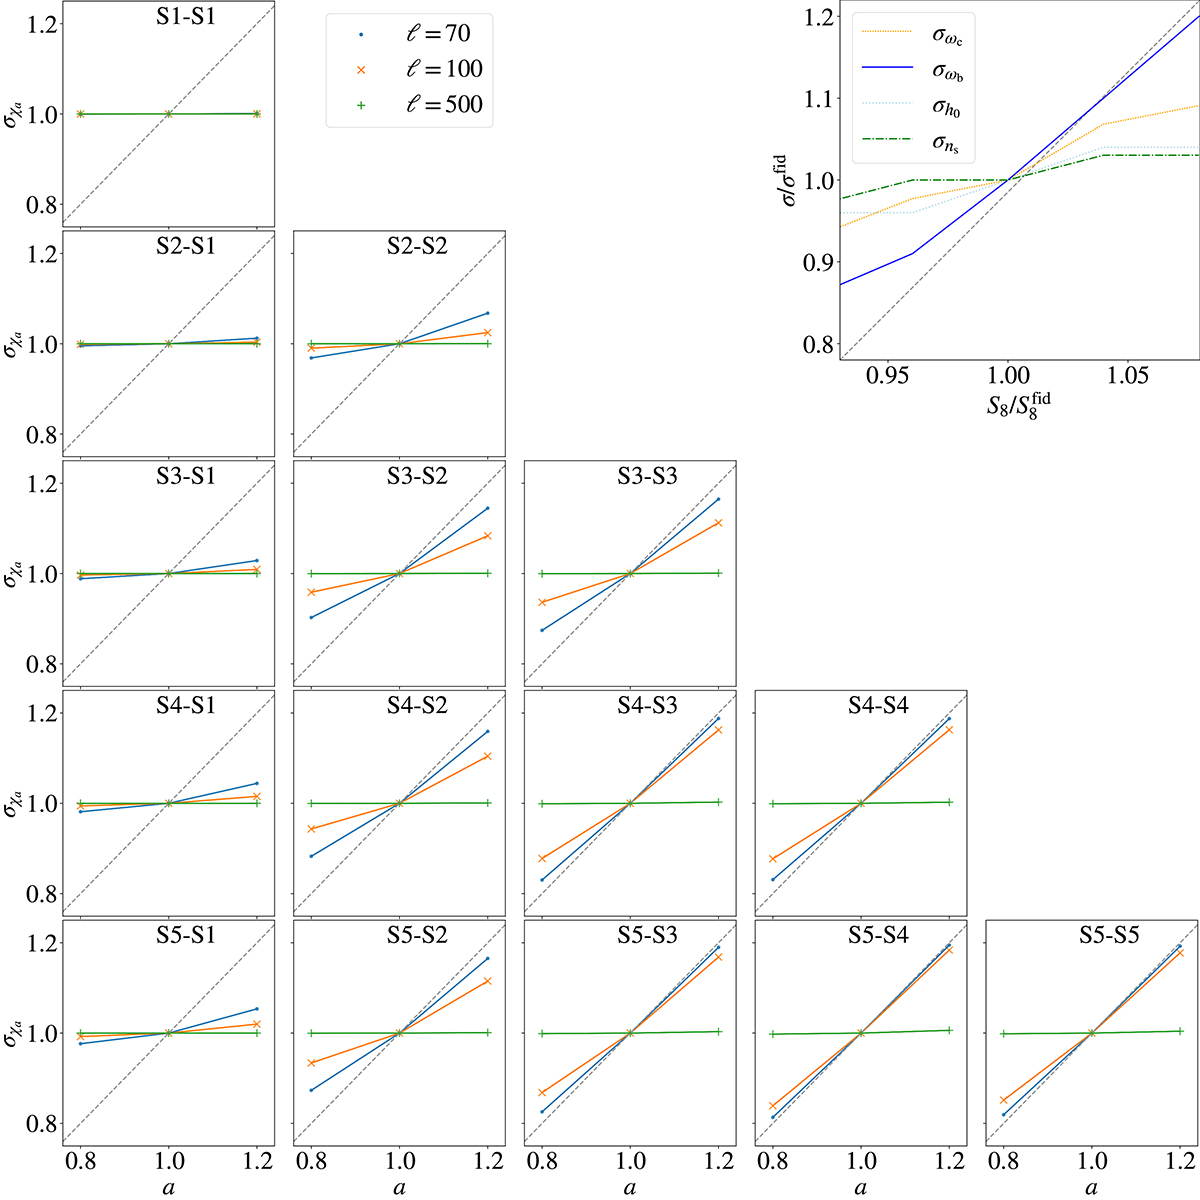
Fig. F.1.
Download original image
The standard deviation of the analytical likelihood distribution of χa (which is given by the goodness-of-fit of the cosmic shear two-point statistic signal scaled by a factor of a) as a function of the factor a. Each of the panels shows the effect on the shear signal of a different combination of the five KiDS-1000 tomographic bins (S1 to S5). The blue dots represent the σχa values at ℓ = 70 which is just below the scale cuts applied in the anisotropic systematics model. The orange crosses are evaluated at ℓ = 100, while the green plus signs assume ℓ = 500, where the uncertainty is dominated by the shape noise. The panel in the upper right corner shows how the 1σ intervals of the likelihood marginals from KiDS-SBI vary with respect to the change in S8 relative to ![]() as shown in Fig. 17. The grey dashed line in each panel shows a direct proportionality for reference.
as shown in Fig. 17. The grey dashed line in each panel shows a direct proportionality for reference.
Current usage metrics show cumulative count of Article Views (full-text article views including HTML views, PDF and ePub downloads, according to the available data) and Abstracts Views on Vision4Press platform.
Data correspond to usage on the plateform after 2015. The current usage metrics is available 48-96 hours after online publication and is updated daily on week days.
Initial download of the metrics may take a while.